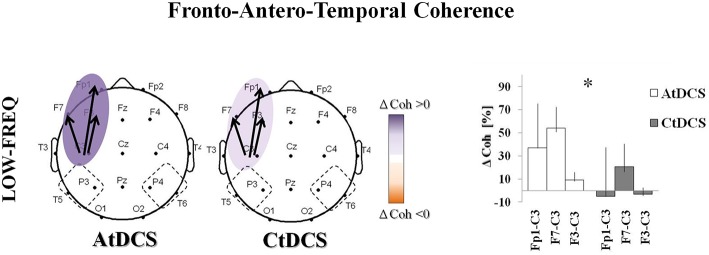
Figure 4.
EEG coherence (Coh) changes induced by Anodal tDCS (AtDCS) and Cathodal tDCS (CtDCS) in the Fronto-Antero-Temporalarea. The panel shows the significant differences on EEG Coh (two-way repeated measure analysis of variance ANOVA; *p < 0.05) for low-frequency (delta): Fp1-C3, F7-C3, F3-C3. The graphical representation of the scalps displays the significant difference on EEG Coh (Violet represents Coh increase and orange Coh decrease from baseline). The bold arrows show the significant differences at post-hoc test. The histograms represent the mean Coh changes (n = 7) after AtDCS (white) and CtDCS (gray). On the y-axis is represented the Coh percentage change from baseline and on the x-axis the EEG channels. Results are expressed as mean ± standard errors (SE).

