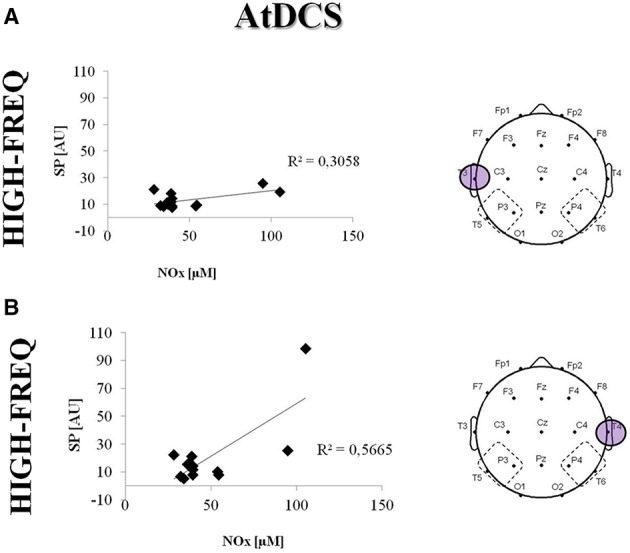
Figure 7.

Correlation between NOx concentration (uM) and Spectral Powers (SP, AU) in the HF under the electrodes T3 (A) and T4 (B) after AtDCS. Single data are represented as diamonds. Solid lines represent the linear regression fit. The correlation coefficient (R2) is reported in each panel.
