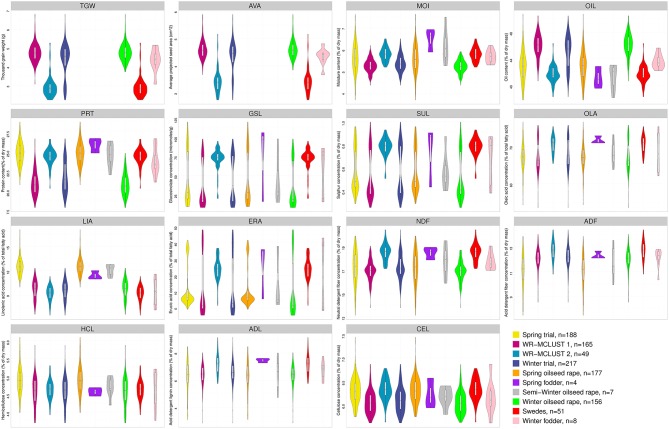
Figure 2.
Frequency distribution of adjusted entry means determined for 15 seed quality traits of the B. napus inbred lines for the spring and winter trial as well as the two WR-MCLUST groups and for six different germplasm types represented by different colors. Yellow plots represent the 188 inbreds of the spring trial and blue plots the 217 inbreds of the winter trial. The number of genotypes for each germplasm type is given in the legend. In each plot, a marker denotes the median of the data, a box indicates the interquartile range, and spikes extend to the upper and lower adjacent values, overlaid is the density.

