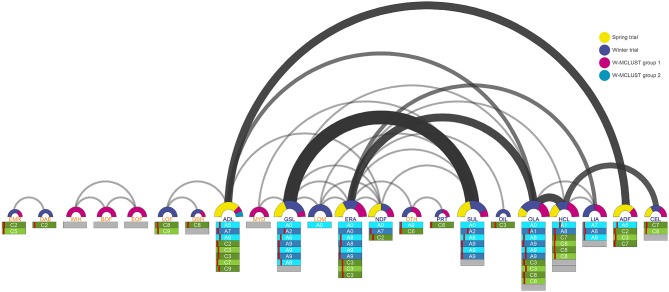
Figure 5.
Arcdiagram of co-localizing SNP-trait associations between two or more traits for the agronomic and seed quality traits. The width of the arcs as well as the size of the semicircles are related to the number of co-localizing SNP-trait associations between the connected traits. The colors of the semicircles represent the distribution of the co-localizing SNP-trait associations to the spring trial, winter trial, and the WR-MCLUST groups 1 and 2. The bars below the traits symbolize the chromosomes and the red dashes the position of the respective co-localizing SNP-trait associations on these chromosomes. The chromosomes of the A genome are colored blue and the chromosomes of the C genome green. Unknown chromosome positions are colored gray.

