
Figure 2.
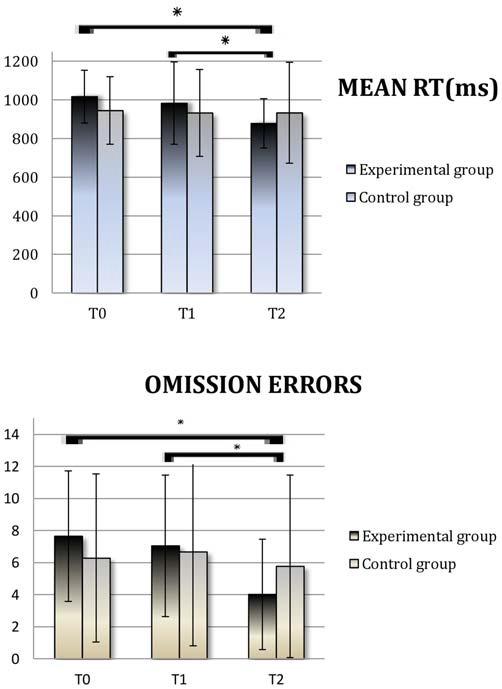
Divided Attention (DA): Average scores obtained at T0 (Baseline), T1 (pre-Treatment) and T2 (post-Treatment) by the experimental group and the control group. Reaction time (RT) is expressed in milliseconds. RT; OE, Omission Errors. Asterisks indicate when the difference between performances is statistically significant.