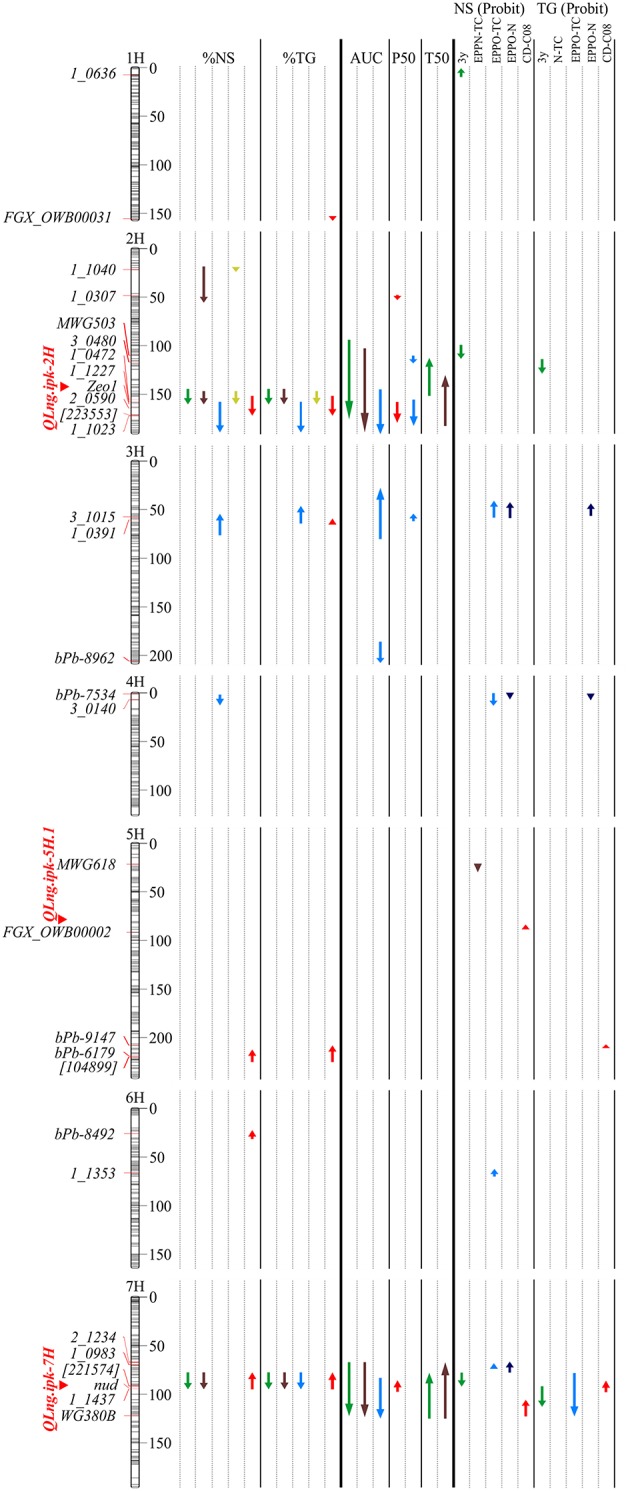
Figure 3.

Linkage map of Oregon Wolfe Barley (OWB) mapping population and quantitative trait locus (QTL) locations. QTLs detected under control conditions are marked in green (TC, treatment control, dark green; C08, control prepared in 2008, light green), those under nitrogen pressure (EPPN) in brown, under oxygen pressure (EPPO) in blue, and those after CD in 2008 red. Map distances are shown in cM. QTLs declared above a logarithm of odds (LOD) threshold of 3. Arrow lengths indicate QTL intervals having LOD > 3 and arrows up indicate that alleles came from the “OWB-D” parent and those down from the “OWB-R” parent.
