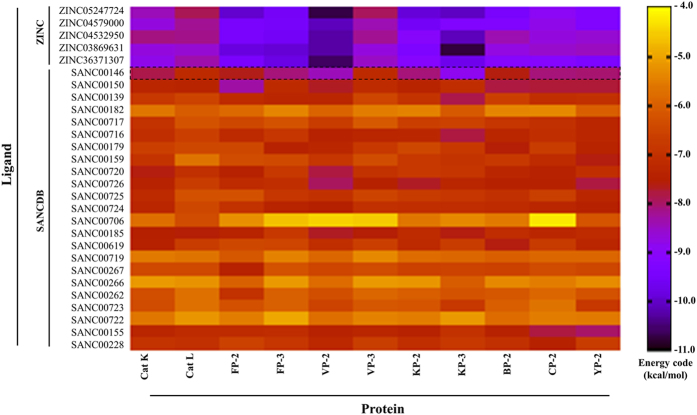
Figure 3. AutoDock binding energies.
A heatmap showing the interaction energies of the SA subset of natural compounds and selected ZINC hits when docked against human cathepsins and plasmodial cysteine proteases. Shown by the dotted box are the energy profiles of the interaction between 5PGA and the corresponding protease. The energy code shows regions with interaction energy ranging from low (yellow) to high (black).

