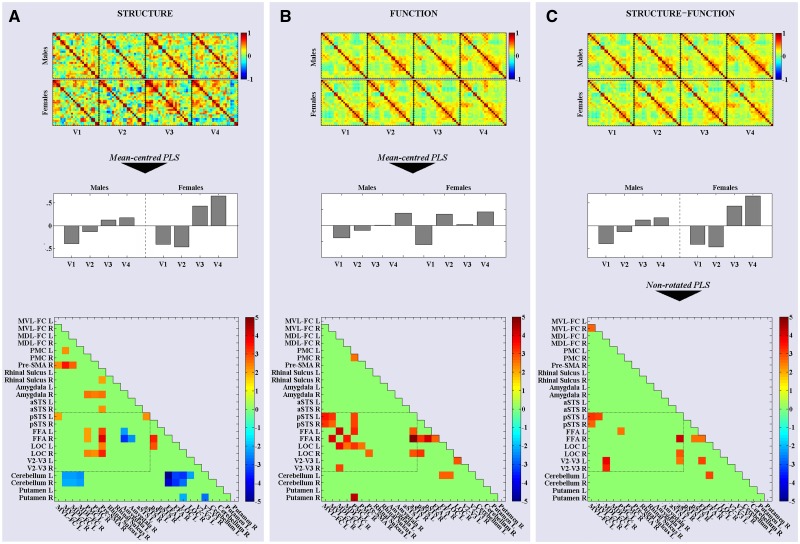
Fig. 2.
The process behind and results emerging from the PLS analyses. (A) The eight structural correlation matrices (top) were entered into a mean-centred PLS analysis (PLSstruc). This produced two LVs, the second of which comprised a ‘visit profile’ (middle) that revealed a large change in structural covariance between Visits 1 and 4 (V1–V4) and sex-specific trajectories. The singular image of this second LV (bottom) highlights the pairwise correlations expressing this trajectory—warm cells are correlated positively and cold cells negatively with the visit profile. Note: The image presents the elements of the LV after statistical analysis (see text), and so the singular image presents bootstrapped ratio values. (B) The eight functional correlation matrices generated by concatenating the Ambiguous-face blocks (top) were entered into a mean-centred PLS (PLSfunc), producing a visit profile (middle) that identified increased functional connectivity between Visits 1 and 4 similar to PLSstruc. The corresponding bootstrapped singular image (bottom) also included some of the same pairwise correlations. (C) The eight functional correlation matrices from the Ambiguous-face blocks (top) were entered into a non-rotated PLS analysis (PLSstruc–func), in which the saliences of the visit profile from PLSstruc were used as contrasts. This allowed us to investigate the degree of association between the developmental trajectories of structural and functional covariance. The bootstrapped singular image (bottom) illustrates the subset of ROIs among which this was true. Note: The cells encompassed by dashed lines within each singular image represent pairwise correlations between distal ‘obligatory’ and ‘optional’ ROIs (see text). This collection of ROI pairs is referred to as the ‘optional-obligatory sub-network’ in the text.

