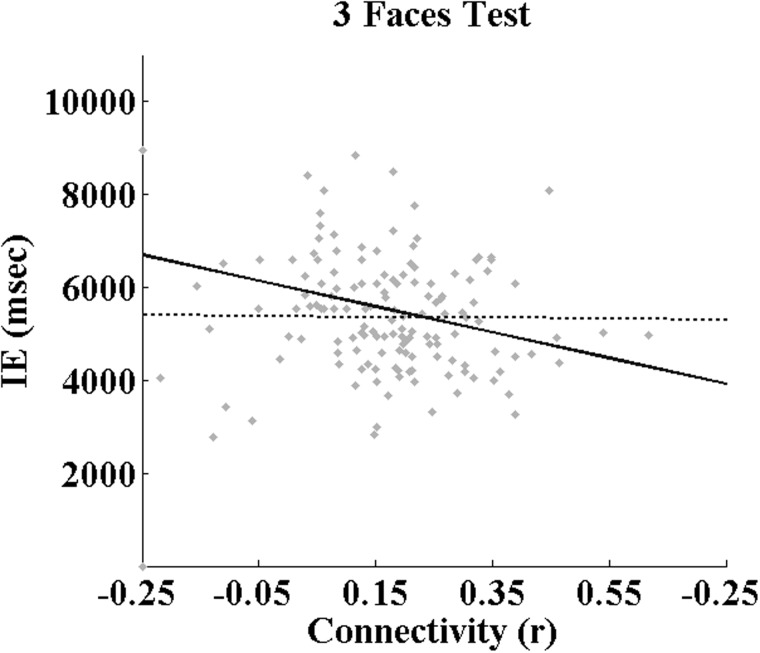
Fig. 3.
Results of mixed-model regression analyses applied to the inverted-efficiency scores on the ‘Three Faces Test’ at all four visits. The trendline represents the significant effect of ‘Connectivitystruc–func’ separately for males and females (dashed and solid line, respectively); that is, the mean inter-regional correlation coefficient among all ROIs comprising the ‘obligatory-optional’ sub-network identified by PLSstruc–func (see text and Figure 2C). Table 3 presents the corresponding coefficients.

