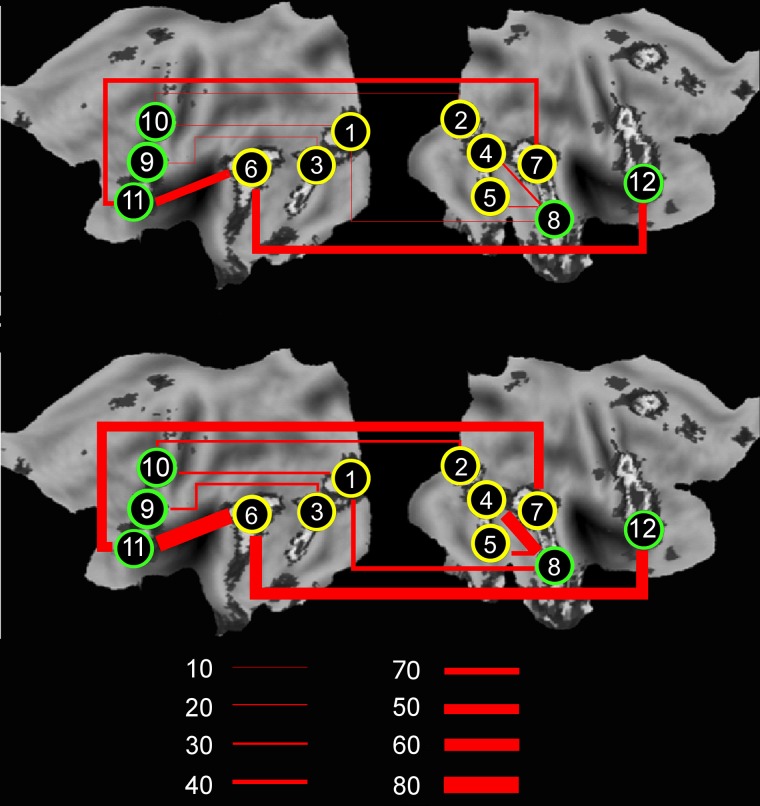
Fig. 4.
Developmental increases in functional connectivity between Visits 1 and 4. The image illustrates the percentage of adolescents at Visits 1 (top) and 4 (bottom) showing a pairwise correlation greater than r = 0.3 between pairs of distal ROIs that integrate the ‘obligatory’ (yellow) and ‘optional’ (green) nodes, as identified by PLSstruc–func. This demonstrates increases from Visit 1 to 4 in long-range functional connectivity between pairs of brain regions that express parallel developmental trajectories in structural and functional covariance: 1 = Left V2/V3; 2 = right V2/V3; 3 = left FFA; 4 = right FFA; 5 = right LOC; 6 = left pSTS; 7 = right pSTS; 8 = right aSTS; 9 = left MDL-PFC; 10 = left PMC; 11 = left MVL-PFC; 12 = right MVL-PFC.

