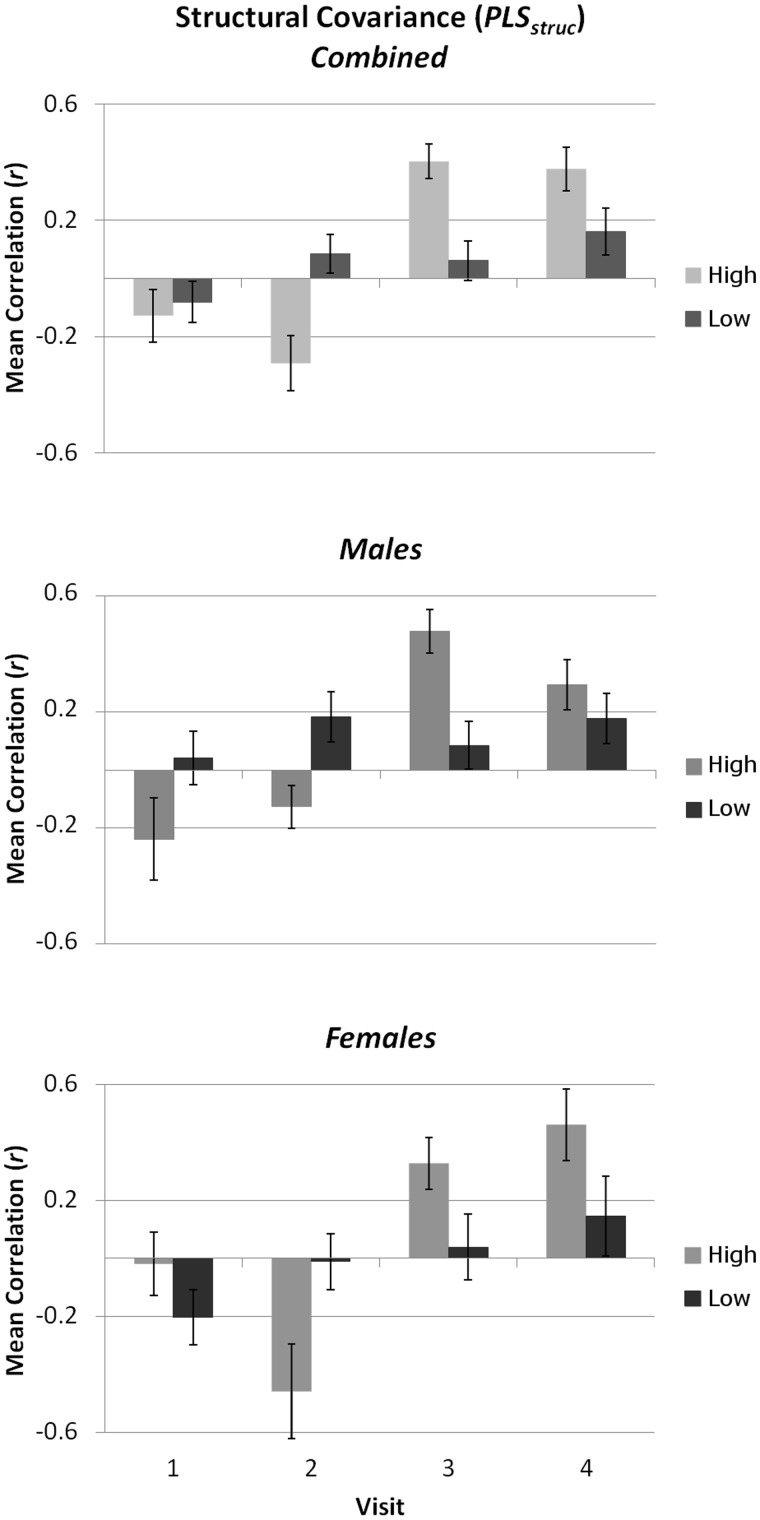
Fig. 5.
The relationship between structural covariance and face-processing performance. Bars present the mean (±SE) correlation coefficient for GM volume among all pairs of ROIs comprising the ‘obligatory-option’ network identified by PLSstruc. Mean coefficients are given separately for individuals scoring above or below the median on the majority of face-processing measures (see text). Although not significant, there were strong trends towards sex-related interactive effects. This figure illustrates a pattern of increasing GM covariance across visits, particularly for high-performing adolescents.

