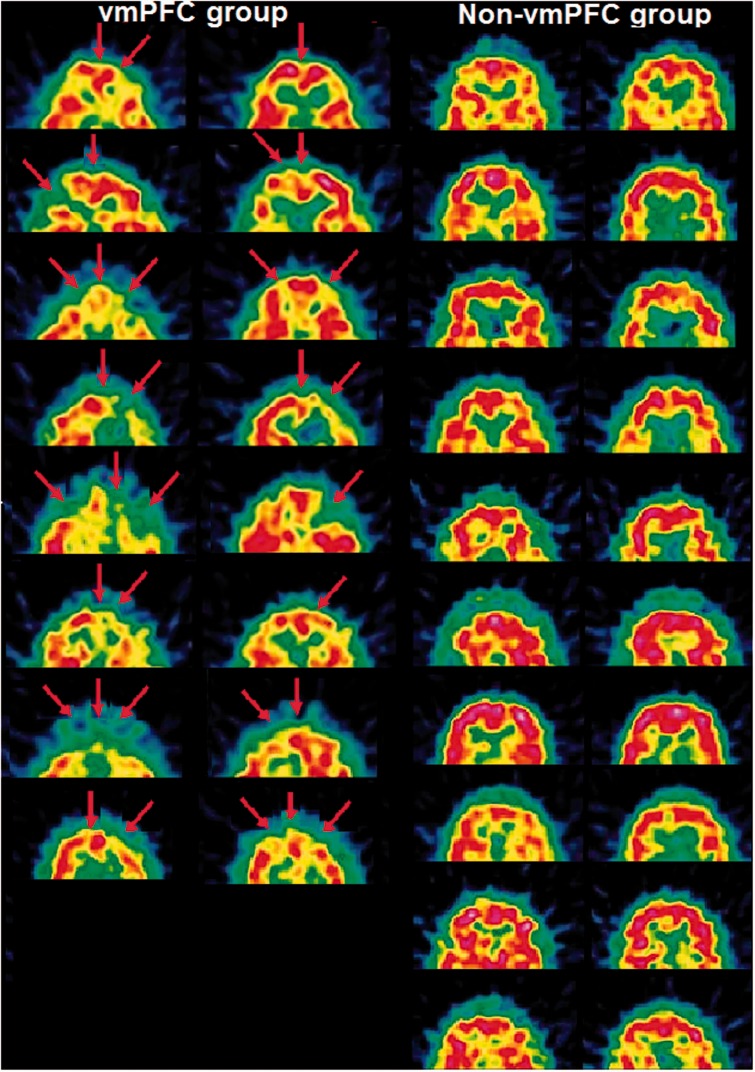
Fig. 1.
SPECT-scans of the patients (two images per patient). Left: vmPFC group consisting of 8 patients with hypoperfusion (indicated by the arrows) of the vmPFC; Right: Non-vmPFC group consisting of 10 patients with hypoperfusion in temporal and/or parietal regions, with no hypoperfusion in the vmPFC and adjacent regions.

