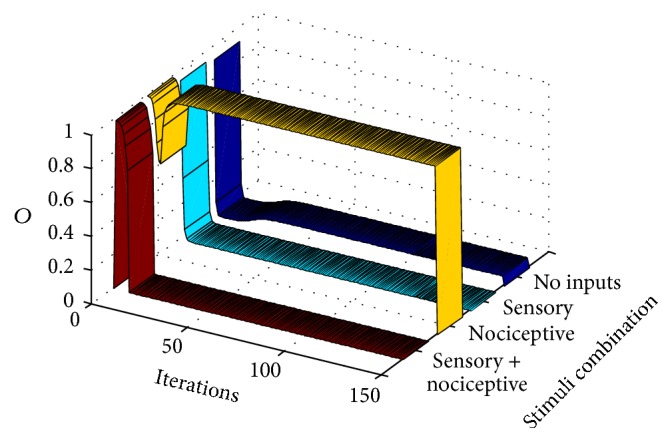
Figure 4.

This graph shows the output, O, of the CT neuron in the gate circuit along computer iterations. It shows that the circuit quickly adapts, for eliciting standard gate outputs when standard pain and sensory signal are input to the circuit (a standard training epoch is given to the circuit in each iteration). Each ribbon represents the output of the circuit when a certain combination of inputs is introduced as input to the circuit. The dark blue ribbon yields the output (the CT neuron action potential probability) when no inputs are introduced. Cyan, yellow, and red ribbons yield the CT neuron output under conditions in which only sensory, nociceptive, or both inputs are, respectively, input to the gate circuit.
