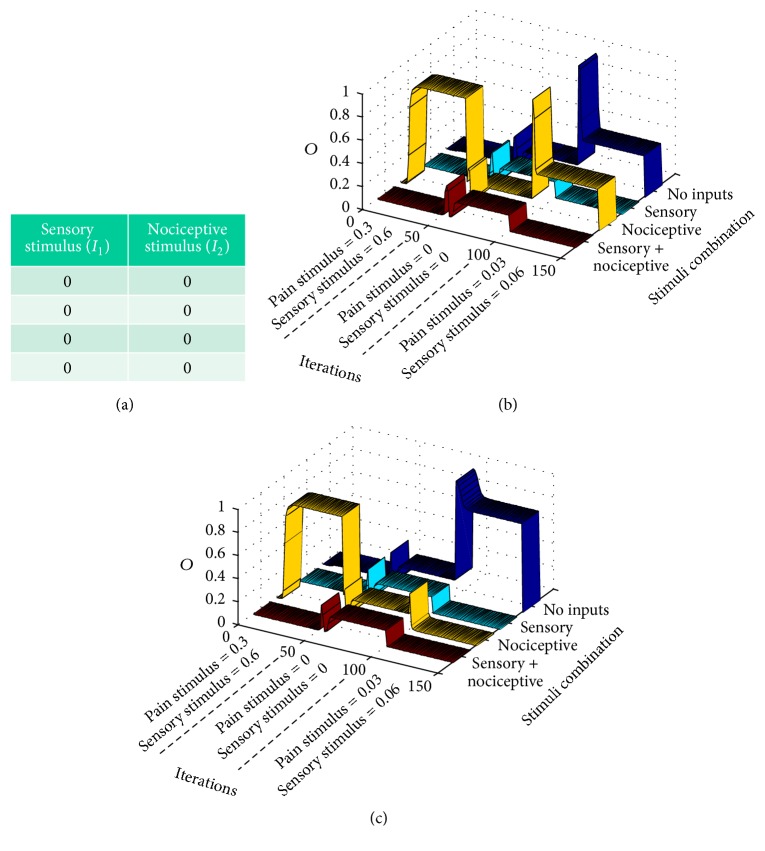
Figure 7.
Modeling phantom limb pain: after presenting a standard training epoch to the gate model during 50 iterations, (a) a null training epoch is input to the gate along 50 more iterations in order to model the period after amputation. (b and c) After 100 iterations, very weak input signals are input to the gate model. Graphs correspond to two stability points. Both graphs show that pain signals are emitted from CT neurons in a situation in which there are no inputs to the gate in a condition known as dysesthesia (blue ribbon). Graph (b) shows a situation of a setpoint in which weak nociceptive inputs elicit a pain signal from CT neurons (yellow ribbon).

