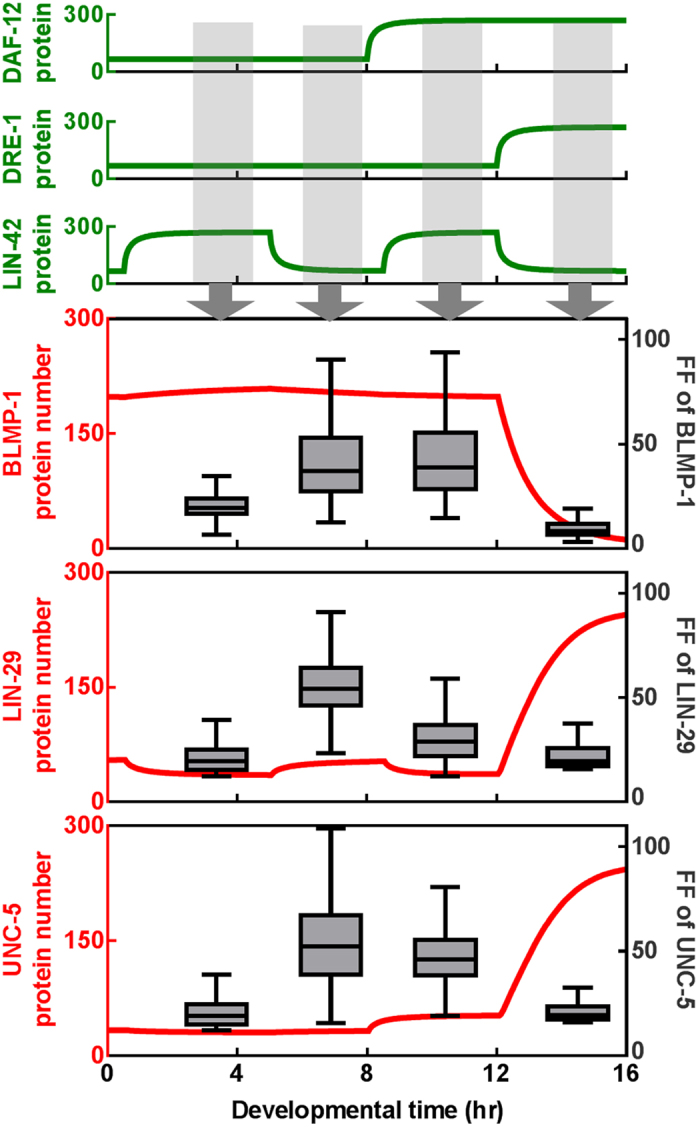
Figure 5. Noise propagation in the complete network, calculated with intrinsic noises included in all nodes.

Shown on top are the activity of the three input genes, DAF-12, DRE-1 and LIN-42. The red curves are the mean trajectories, scaled to the left, of the 3 downstream components. Gray boxes and whiskers are for the FF distribution of the corresponding components, calculated at the steady state of the 4 different developmental stages as indicated.
