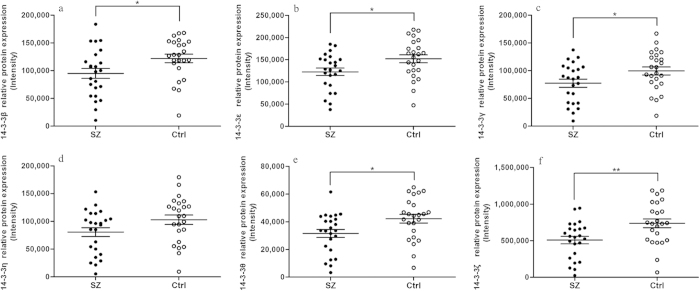
Figure 2. Relative protein expression levels of the 14-3-3 isoforms in schizophrenic (SZ) patients and healthy control (Ctrl) subjects.
(a) 14-3-3β. (b) 14-3-3ε. (c) 14-3-3γ. (d) 14-3-3η. (e) 14-3-3θ. (f) 14-3-3ζ. Horizontal and vertical lines indicate the mean ± S.E.M. values. *p < 0.05, **p < 0.01.

