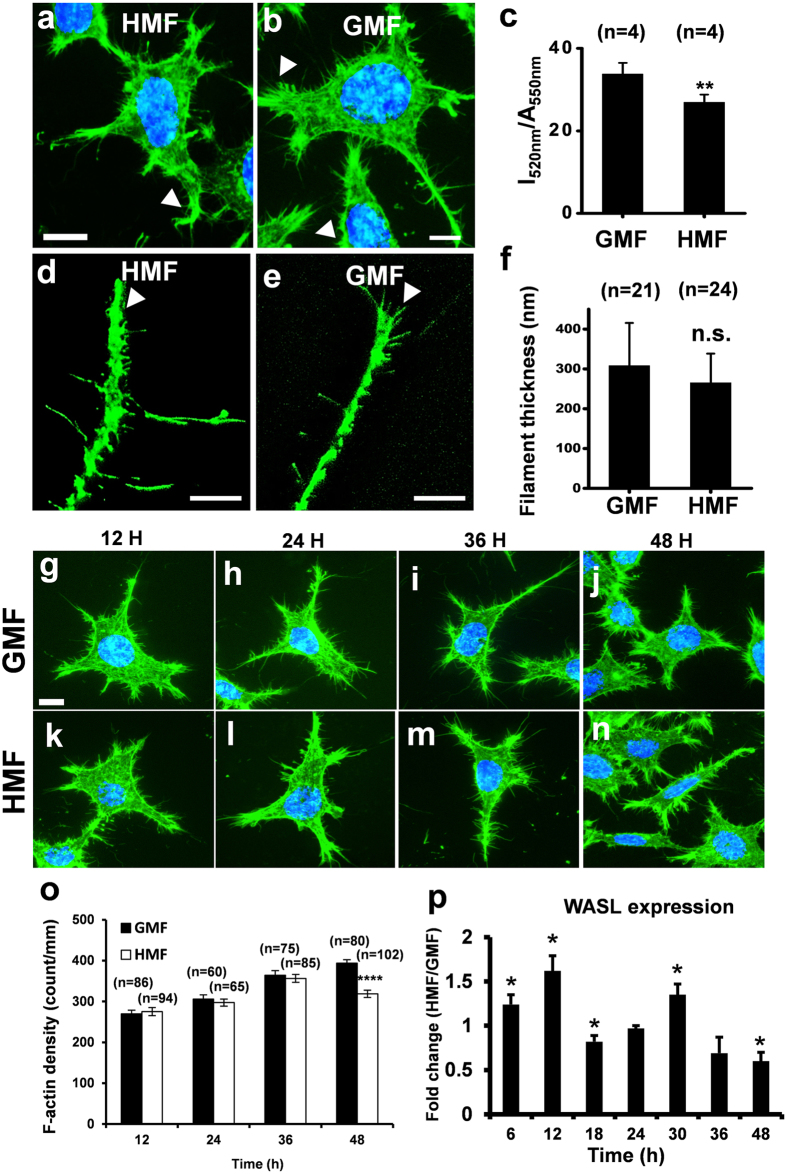
Figure 6. Reduced cellular F-actin in HMF-exposed cells.
Representative images of cells exposed to either the HMF (a) or GMF (b) after 2 days. Cells are stained with FITC-phalloidin (green). The nuclei were stained with Hoechst (blue). Typical cell front protrusions are indicated using white arrowheads. (c) Quantification of the cellular F-actin showed that 2 days of HMF exposure results in cells with significantly less F-actin. After 2 days of exposure to the HMF (d) and GMF (e) fewer F-actin fibers were located at the tip of cell protrusion of the HMF-exposed cells than the GMF control. (f) Thicknesses of F-actin fibers of cells in the GMF and HMF conditions were similar. Representative photos of FITC-phalloidin-stained SH-SY5Y cells in the GMF (g–j) and HMF (k–n) at 12 h (a,k), 24 h (h,f), 36 h (i,m) and 48 h (j,n). (o) The F-actin densities of the HMF-exposed cells was not significantly different to the GMF controls from 12 h to 36 h but decreased significantly at 48 h. (p) The dynamic relative expression levels of WASL (HMF/GMF) during the 48 h exposure period. The transcriptional expression of WASL of the HMF cells was lower than the GMF control at 18 h and 48 h but higher from 6–12 h and at 30 h. Data in (c) were from independent experiments (n = 4), and are shown as mean ± s.e.m. Data in (f) were from randomly-selected individual fibers from three independent experiments (n is the number of actin fibers), and are shown as mean ± s.d. Data in (o) were from randomly selected cells from three independent experiments (n is the number of cells), and shown as mean ± s.e.m. Data in (p) were from three independent experiments at each sampling time point, and shown as mean ± s.e.m. The P values were calculated using a one-way ANOVA. *P < 0.05, **P < 0.01, ****P < 0.0001.

