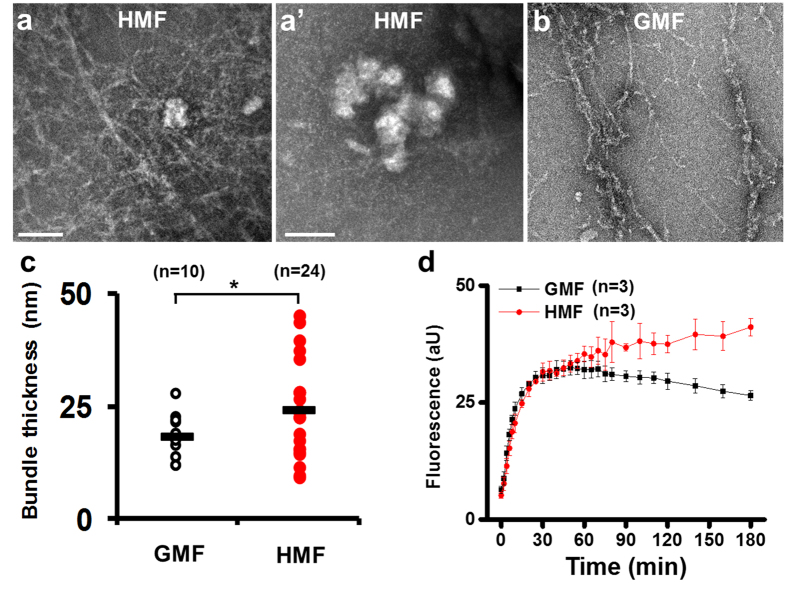
Figure 7. Disordered in vitro actin self-assembly in the HMF.
Electron microscopy of the end products of actin self-assembly reaction showed that fibers and granules were formed in the HMF (a,a′) but only fibers were found in the GMF (b). (c) Fibrils produced in the HMF were found to be significantly thicker than those produced in the GMF. (d) The fluorescence changes of the actin self-assembly mixtures were monitored for 3 h. The reaction kinetics changed remarkably after 60 min. Data in (c) were measured from randomly selected individual fibrils (n) from three independent experiments. The P values were calculated using the Kolmogorov-Smirnov test. *P < 0.05. Data in (d) were from three independent experiments and are shown as mean ± s.d.

