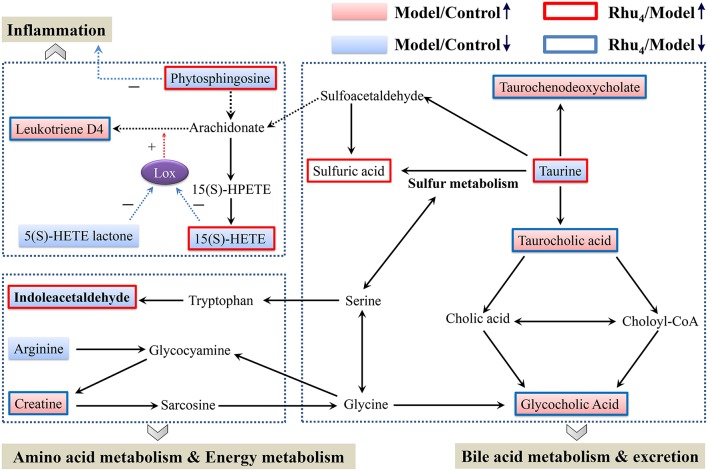
Figure 7.
Schematic diagram of the disturbed metabolic pathway related to ANIT and rhubarb treatment. The pink and light blue boxes indicate metabolites significantly higher and lower in the model group than in the control group, respectively. The boxes bordered in red and blue represent metabolites that are significantly higher and lower in the Rhu4 group than in control group, respectively. Lox in the figure stands for lipoxygenase.

