Figure 3.

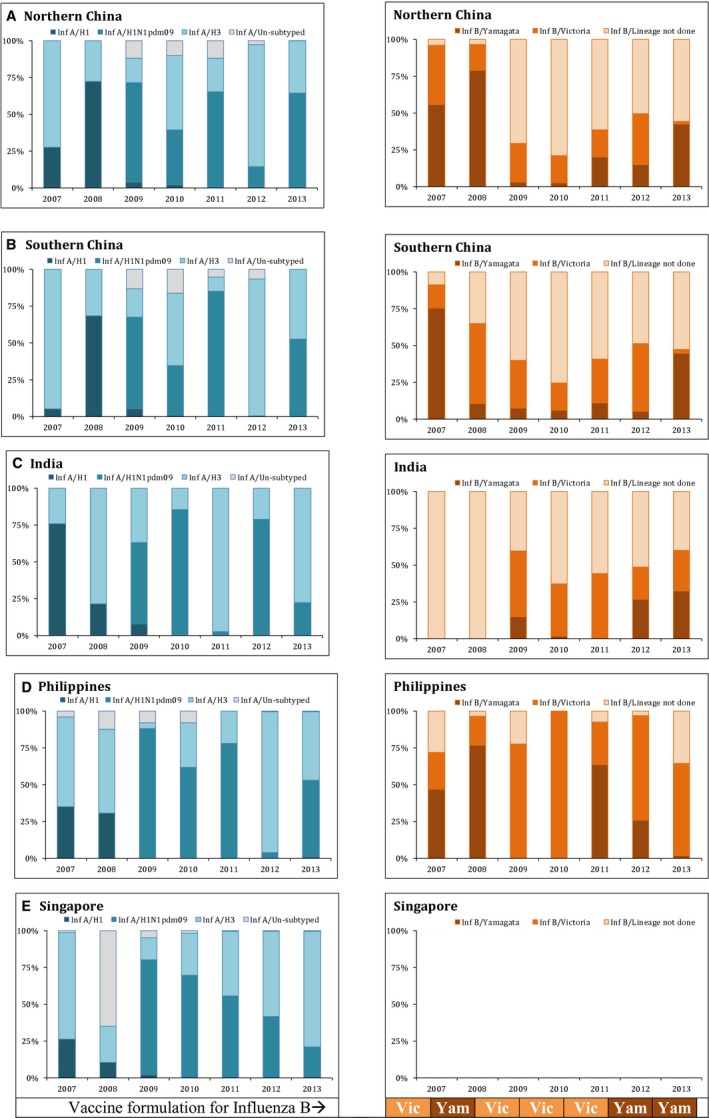
Subtype variation in selected study countries in the Asian region (2007–2013). Each panel graph is for each country and influenza type, and stacked bars denote the circulating subtypes during the year.

Subtype variation in selected study countries in the Asian region (2007–2013). Each panel graph is for each country and influenza type, and stacked bars denote the circulating subtypes during the year.