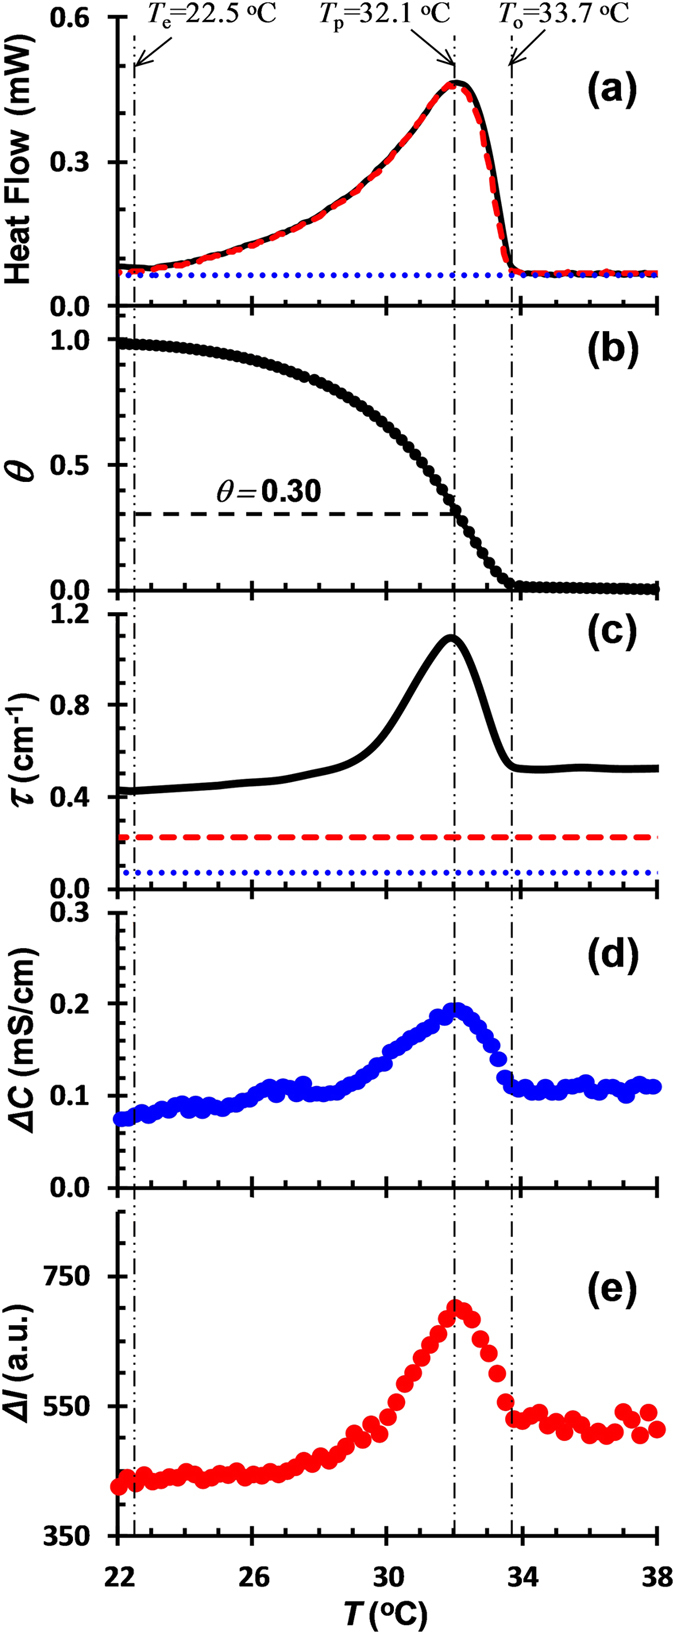
Figure 3.

(a) DSC curves of 0.75% κ-car (dashed line), 0.75% gelatin (dotted line), and 0.75% κ-car/0.75% gelatin mixture (solid line) upon cooling; (b) κ-car helix content θ as a function of temperature calculated from DSC according to eq. 2; (c) Turbidity τ of 0.75% κ-car (dashed line), 0.75% gelatin (dotted line), and 0.75% κ-car/0.75% gelatin mixture (solid line) upon cooling; (d) Difference in conductivity between 0.75% κ-car and 0.75% κ-car/0.75% gelatin mixture (ΔC = Cκ-car − Cκ-car/gelatin) as a function of temperature; (e) Difference in fluorescence intensity between 0.75% gelatin and 0.75% κ-car/0.75% gelatin mixture (ΔI = Igelatin − Iκ-car/gelatin) as a function of temperature. Cooling rate: 0.5 °C/min; pH: 7.0; Solvent: 70 mM Me4NI.
