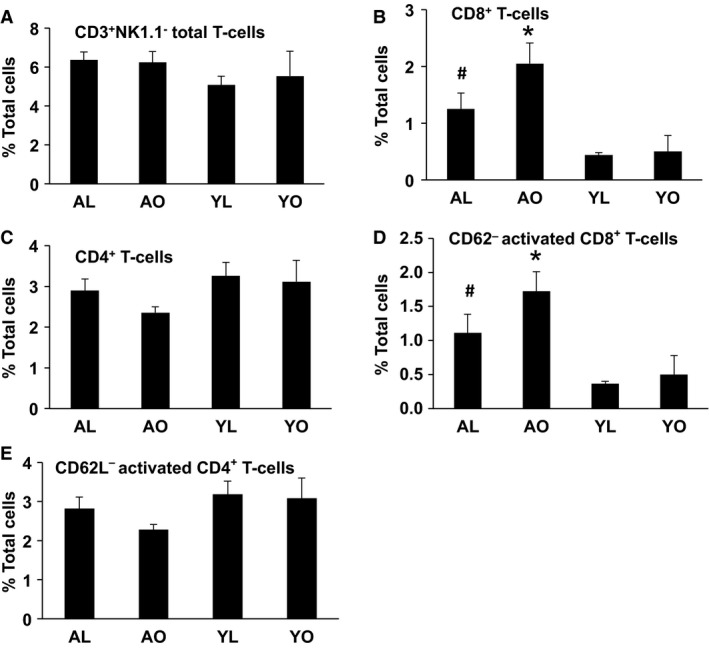
Figure 6.

The influence of aging, obesity, and diet on CD3+NK1.1− cells (T cells) and their subpopulations in liver. Liver immune cells were isolated and stained for CD3, NK1.1, CD4, CD8, and CD62L markers and analyzed by flow cytometry. Data are presented as mean ± SE (minimum of five animals/group analyzed individually). Significant differences are indicated (#compared to YL, *compared to YO, P < 0.05).
