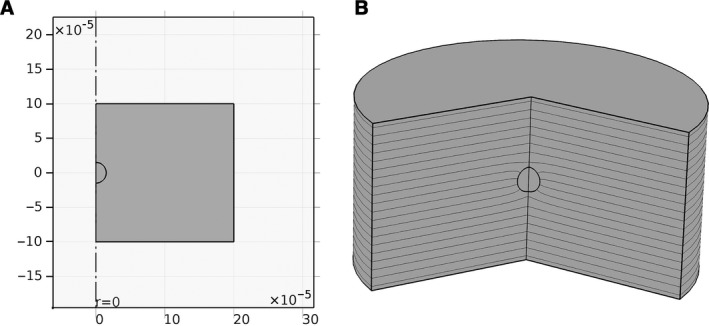
Figure 3.

(A) 2D axisymmetry model for a single spherical cell between two plate electrodes. The dashed‐dot line shows the symmetry axis. The upper and lower electrodes are shown by arrows in the figure. (B) A section of the 3D view of the model. The lines in the figure show the contours of electric potential. It can be seen that the lines are bent around the cell due to the presence of the cell.
