
Figure 4.
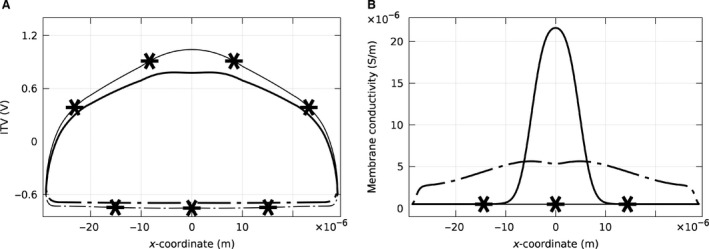
(A) Induced transmembrane voltage and (B) membrane conductivity for a single cell attached to a conductive slide. The applied electric field was 400 V m−1. The lines with the asterisks belong to the static case in which conductivity of the membrane is considered constant. The lines without asterisks correspond to the dynamic case in which conductivity of the membrane changes as a function of the ITV. The solid lines demonstrate the results for the apical side, while the dash‐dot lines show the results for the basal side of the cell. The ITV in the static case for a single cell is larger on the apical side. This results in a larger conductivity in the dynamic case, which, in turn, causes the reduction of ITV so that the ITV has almost the same maximum value for both the apical and basal sides.