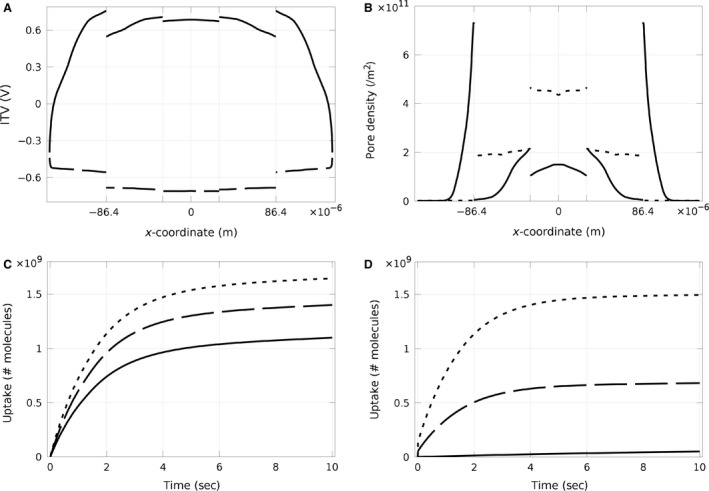
Figure 7.

Dynamic case study for electroporation of five adjacent endothelial cells in a multicellular layer or cluster. (A) Induced transmembrane voltage and (B) pore density of a 10 msec pulse of 150 V m−1 at the apical (solid line) and the basal (dashed line) side of five adjacent cells on a spot. The vertical grids in (A) and (B) show the location of each cell, considering the middle cell on x = 0. The ITV and consequently pore density are not uniform along the membrane of each cell and very different on the adjacent cells. (C) and (D) display the uptake of different cells in the multicellular model for direct and reverse electroporation, respectively. The solid lines, dashed lines, and dotted lines are related to the cells on the edges, cells adjacent to the edge cells, and cells adjacent to the middle cell, respectively. It is clear that uptake of the cell in the middle is the highest, and uptake for the cells on the edges is the lowest.
