
Figure 3.
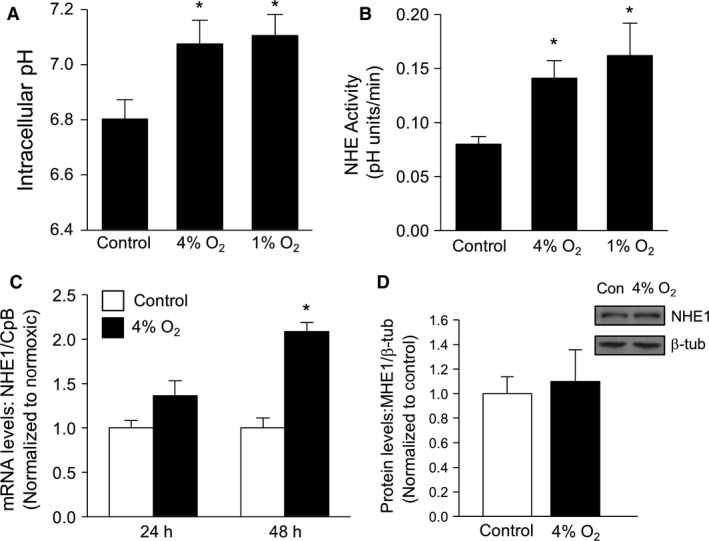
Exposure to in vitro hypoxia increases basal pHi and NHE activity, but not NHE1 expression, in PASMCs. (A) Bar graphs illustrating average basal pHi measured in PASMCs during perfusion with HEPES‐buffered extracellular solution after exposure for 24 h to control conditions (n = 12), 4% O2 (n = 6), or 1% O2 (n = 7). (B) Bar graphs illustrating mean values for Na+‐dependent recovery rates from acidosis at 2 min compared in PASMCs exposed to control conditions (n = 12), 4% O2 (n = 6), or 1% O2 (n = 5). (C) Bar graph showing NHE1 mRNA expression (normalized to cyclophilin B) in PASMCs exposed to control conditions (n = 4 for 24 and n = 5 for 48 h) or 4% O2 (n = 4 for 24 and n = 4 for 48 h). (D) Representative blot and bar graph showing NHE1 protein expression in PASMCs exposed to control conditions (n = 3) or 4% O2 (n = 3) for 24 h. All bar graphs show mean ± SEM data. *Indicates significant difference from N value (P < 0.05).