
Figure 6.
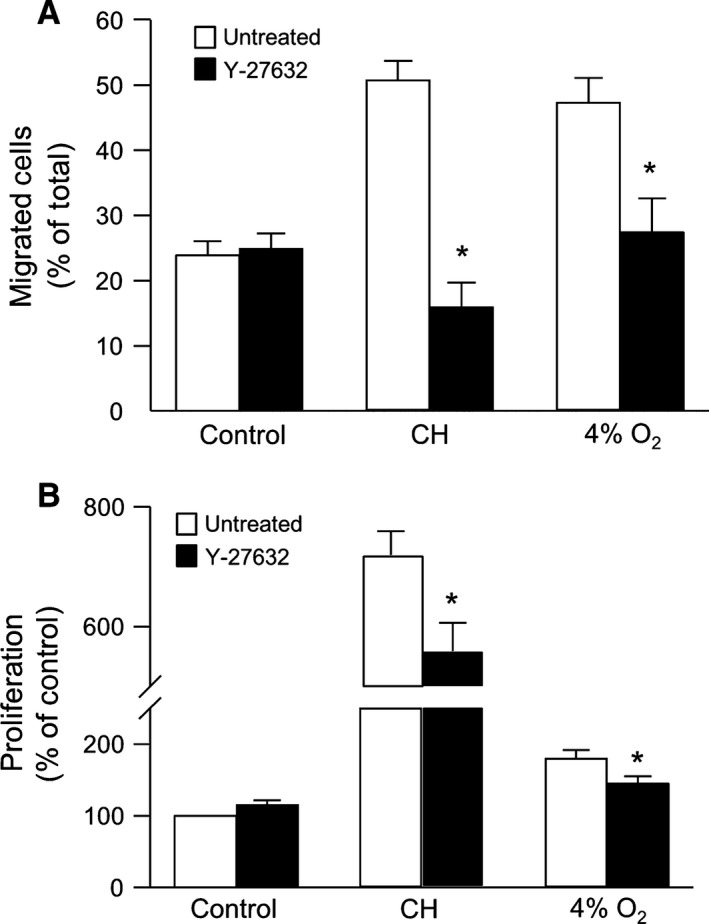
Inhibiting Rho kinase (ROCK) reduces hypoxia‐induced migration and proliferation. (A) Bar graph showing percent migrated PASMCs in the presence and absence of Y‐27632 (10−5 mol/L) under control conditions (n = 15 for untreated and n = 6 for Y‐27632), after isolation from chronically hypoxic (CH) animals (n = 5 for untreated and n = 4 for Y‐27632) or after exposure to 4% O2 (n = 11 for untreated and n = 7 for Y‐27632). (B) Bar graph showing proliferation of PASMCs measured in the presence and absence of Y‐27632 in PASMCs under control conditions (n = 23 for untreated and n = 8 for Y‐27632), after isolation from CH animals (n = 8 for untreated and n = 5 for Y‐27632) or after exposure to 4% O2 (n = 7 for untreated and n = 6 for Y‐27632). All bar graphs show mean ± SEM data. *Indicates significant difference from untreated value within a group (P < 0.05).