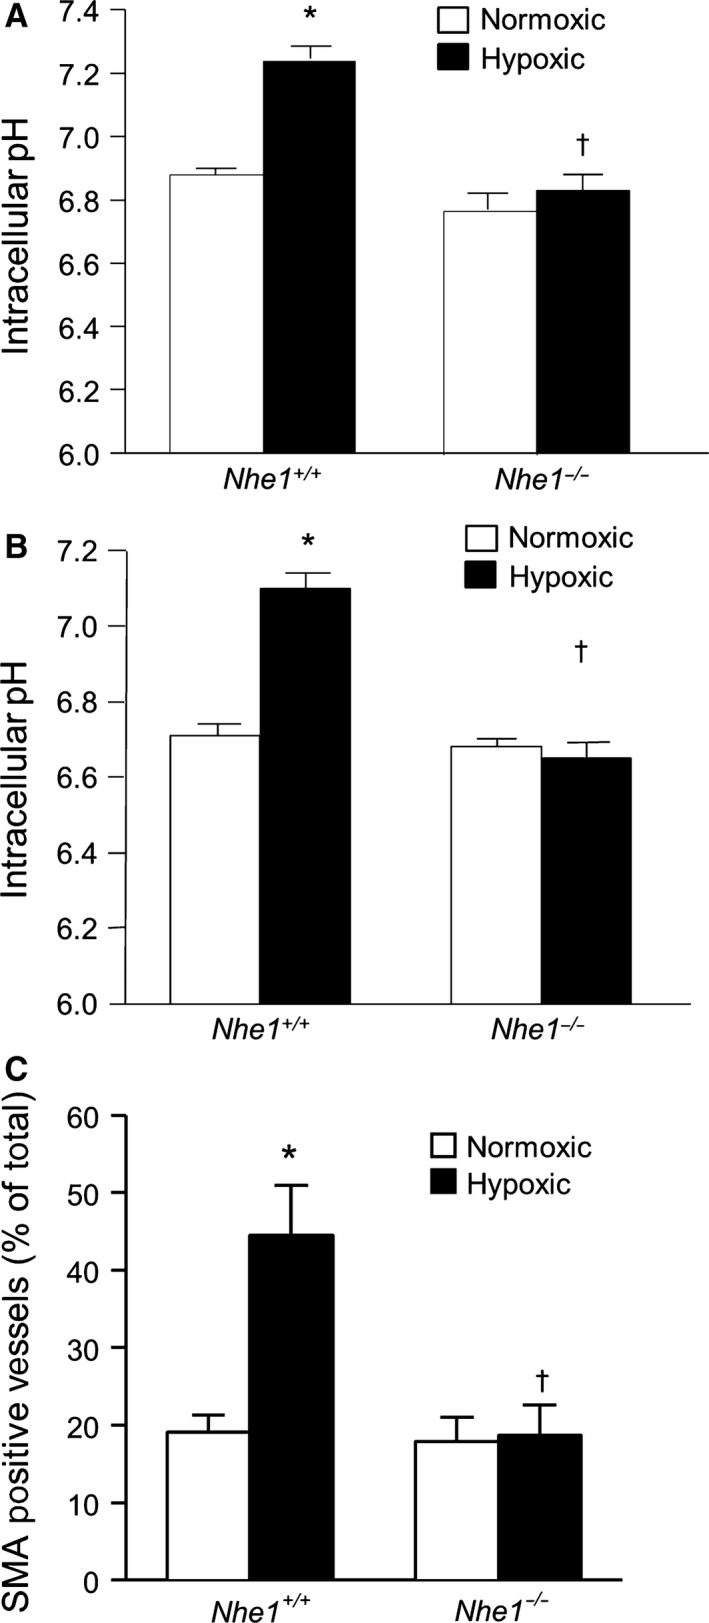
Figure 7.

Deficiency for NHE1 prevents chronic hypoxia‐induced increases in pH homeostasis in mice. Bar graphs show baseline intracellular pH values measured in (A) KRBS solution (n = 3 for normoxic and n = 4 for hypoxic) and (B) HEPES‐buffered solution (n = 3 each) in PASMCs from normoxic and chronically hypoxic wild‐type (Nhe1 +/+) and NHE1‐deficient (Nhe1 −/−) mice. (C) Bar graphs showing percent actin‐positive vessels in Nhe1 +/+ and Nhe1 −/− mice following exposure to normoxia or chronic hypoxia (n = 3 per group). All bar graphs show mean ± SEM data. *Indicates significant difference from normoxic Nhe1 +/+ value (P < 0.05); †indicates significant difference from hypoxic Nhe1 +/+ value.
