
Figure 2.
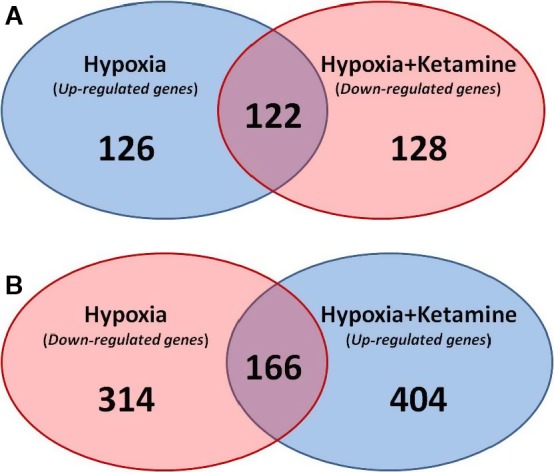
Venn diagram of the number of genes that were significantly regulated by hypoxia and hypoxia + ketamine. (A) Venn diagram showing the number of significant genes that were upregulated by hypoxia (blue), downregulated with ketamine (red), and the common genes involved in both groups (purple). (B) Venn diagram of significant genes that was downregulated by hypoxia (red), upregulated with ketamine (blue), and the common genes involved in both groups (purple).