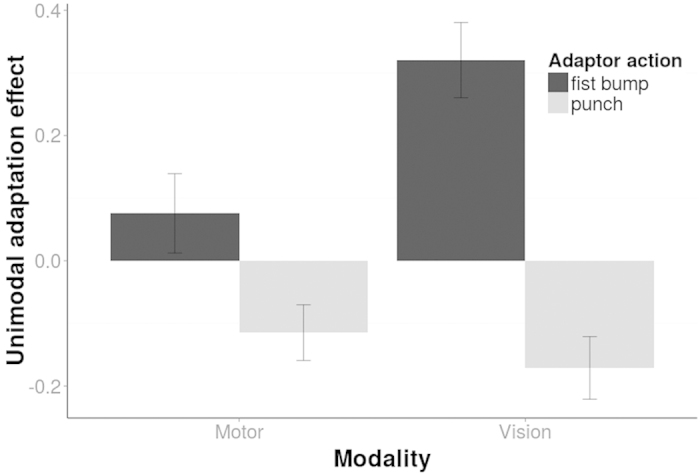
Figure 2. Unimodal adaptation effects shown for the motor (left) and visual (right) modality and each adaptor action (different hues) separately.

The unimodal adaptation effect (y-axis) is measured as the difference of proportion ‘punch’ responses between the action adaptation and a no-adaptation (baseline) condition. Both unimodal conditions show an adaptation effect: participants reported the ambiguous test stimuli to look more like a ‘punch’ after being adapted to a fist bump (dark bars) and vice versa. Bars indicate 1 SE of the mean.
