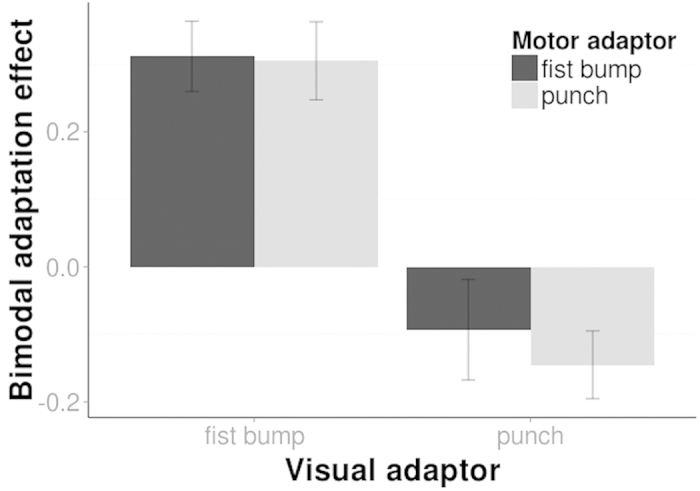
Figure 3. The contribution of the visual action information (along the x axis) and motor action information (different shadings) on bimodal adaptation.

Bimodal adaptation effects measured the difference of proportion ‘punch’ responses between the bimodal action adaptation and the no adaptation (baseline) condition. Bimodal adaptation effects were mainly modulated by the visual action information (i.e. along the x-axis) and not motor action information (i.e. different shadings). Bars indicate 1 SE of the mean.
