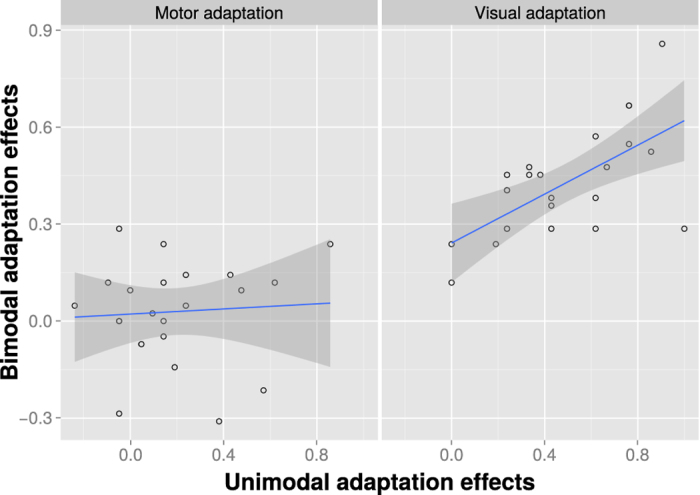
Figure 4. Correlation between unimodal and bimodal adaptation effects.

The correlation is shown for the motor (left) and visual (right) adaptation conditions separately. For the calculation of the correlation data was collapsed across the conditions that were not of interest (e.g. collapsing across motor conditions for the calculation of the visual adaptation effect). The gray shaded area represents the 95% confidence band for the parameter estimates.
