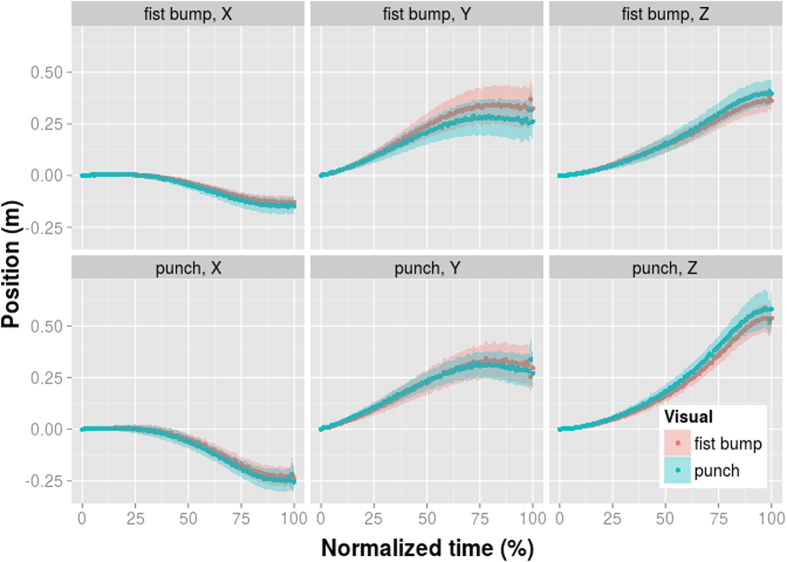
Figure 5. Average spatial position of the hand in the bimodal adaptation control experiment.
The motor adaptor conditions are along rows (top row: fist-bump; bottom row: punch) and the visual adaptor conditions in different colours within each panel (red: fist-bump; blue: punch). The hand position along the x (left-right),y (up-down), and z (forwad-backward) axis is shown across different columns. The normalized time expresses each time point as percent of the overall movement time. The shaded area indicates the 95% confidence interval.

