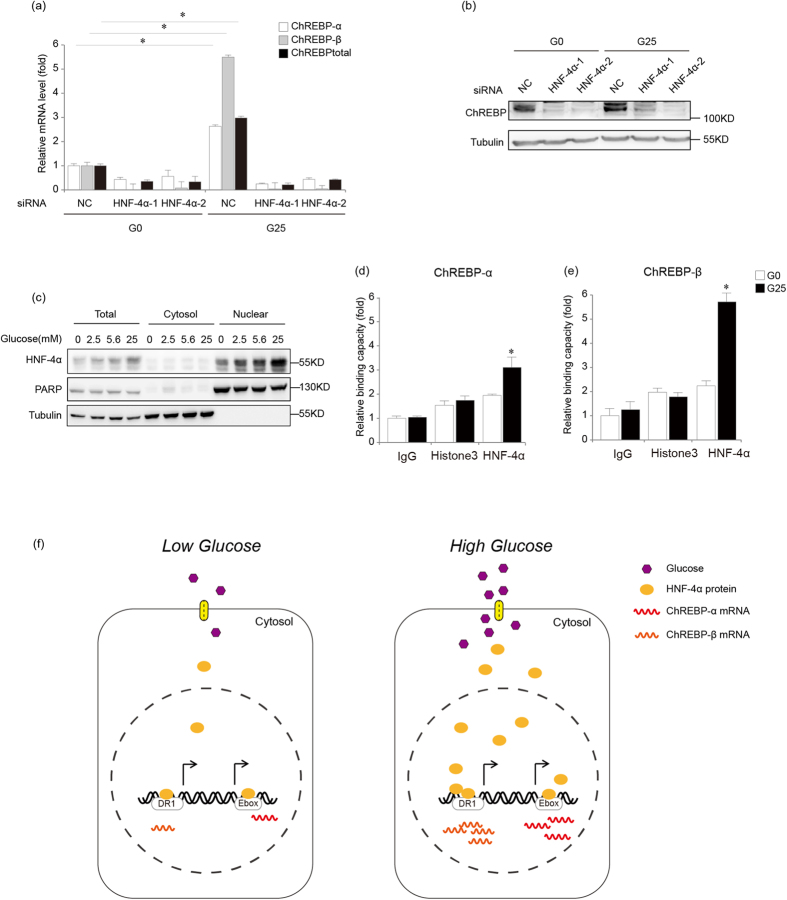
Figure 7. Glucose promotes ChREBP transcription through increasing HNF-4α nuclear abundance and binding to the cis-elements in ChREBP-α and ChREBP-β.
(a). Real-time PCR analysis for mRNA levels of ChREBP-α, ChREBP-β and total ChREBP in HepG2 cells treated with 0 or 25 mM glucose for 18 hours after control (NC) or two HNF-4α siRNAs (HNF-4α-1 and HNF-4α-2) are transfected. *indicates p < 0.05. (b). Western blot analysis for endogenous ChREBP expression in HepG2 cells treated with 0 or 25 mM glucose for 18 hours after control (NC) or two HNF-4α siRNAs (HNF-4α-1 and HNF-4α-2) are transfected. Tubulin serves as the loading control. (c). Western blot analysis for subcellular localization of endogenous HNF-4α in HepG2 cells after 0, 2.5, 5.6 and 25 mM glucose treatment for 18 hours. PARP and tubulin serve as loading controls and cell fractionation controls. (d,e). ChIP analysis for HepG2 cells using an anti-HNF-4α antibody, nonspecific IgG or anti-histone antibody shows that binding capacity of HNF-4α for ChREBP-α (d) and ChREBP-β (e) increases under the 25 mM glucose condition (G25) when compared to the 0 mM glucose condition (G0). (f). Diagram showing that glucose promotes ChREBP transcription by increasing HNF-4α nuclear localization and binding to the cis-elements in ChREBP-α and ChREBP-β.

