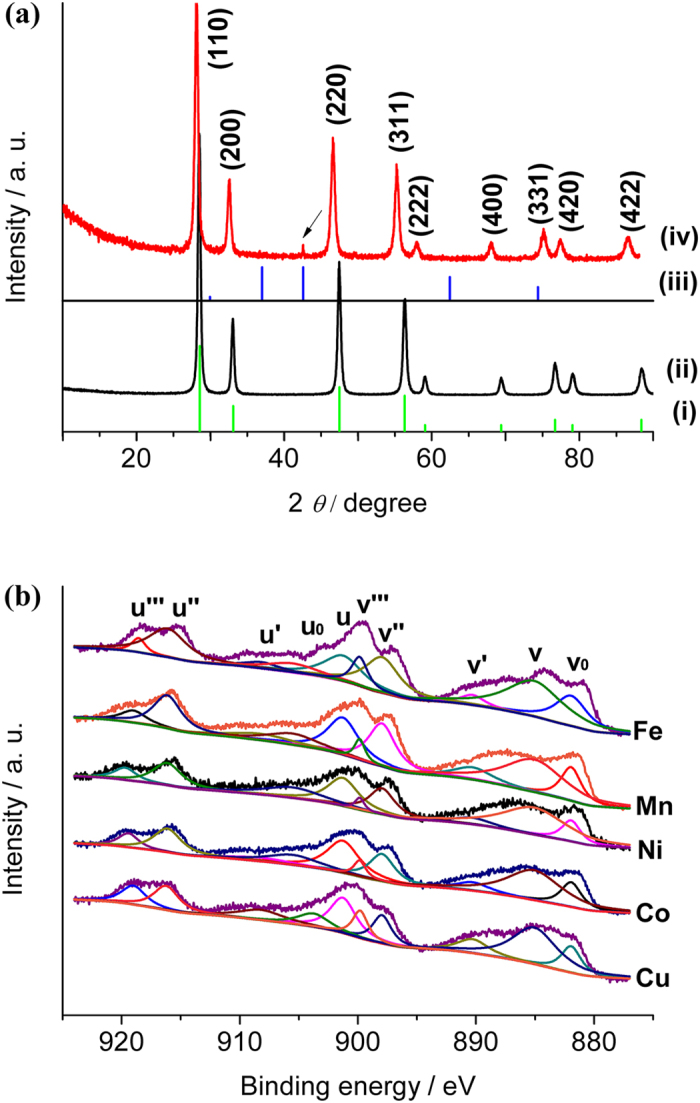
Figure 3.

(a) XRD patterns of: (i) CeO2 standard card (JCPDS No. 34–0394), (ii) CeO2 microspheres, (iii) Cu2O standard card (JCPDS No. 34–1354) and CuxCeO2−X microspheres (The black arrow indicating diffraction peak from substituted Cu2O.) and (b) XPS of MxCeO2−X microspheres at the Ce 3d region: CuxCeO2−X, CoxCeO2−X, NixCeO2−X, MnxCeO2−X and FexCeO2−X.
