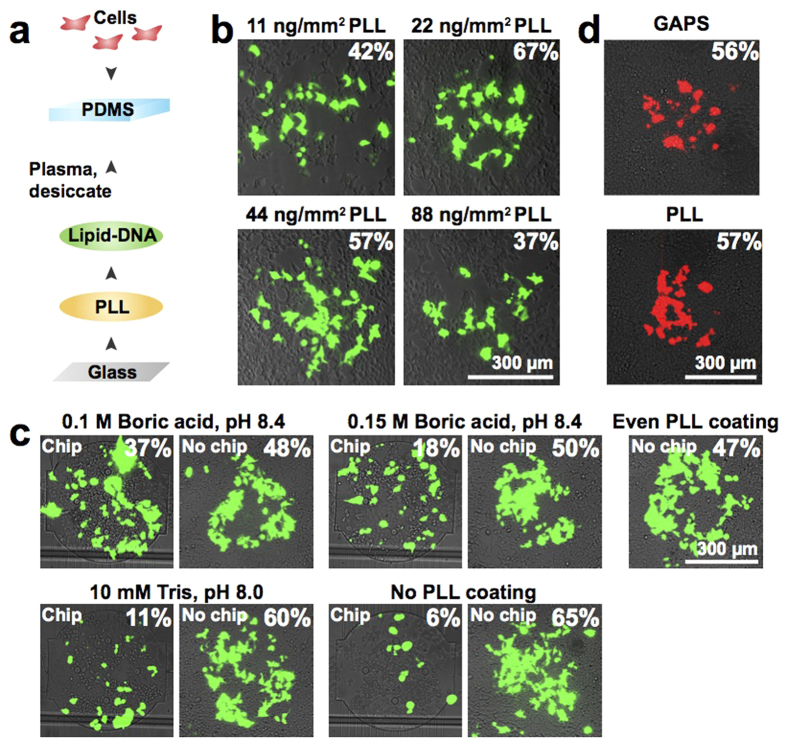
Figure 2. Generation of a microfluidic-compatible reverse transfection array.
(a) Workflow to fabricate the transfection device. (b) Optimization of the amount of PLL deposited during microarraying. eGFP transfection efficiency is indicated for each composite fluorescence image. (c) Effect of the composition of the PLL spotting mixture on eGFP transfection efficiency. The images on the left of each set represent the full assembly (PLL spotted array + DNA array + chip). The images on the right of each set represent the assembly without the chip (PLL spotted array + DNA array). A standard reverse transfection array (evenly coated PLL + DNA array) was also tested. eGFP transfection efficiency is indicated for each composite fluorescence image. (d) Comparison of tdTomato transfection efficiency using a standard GAPS slide or our spotted PLL slide. Transfection efficiencies are indicated for the composite fluorescence images.

