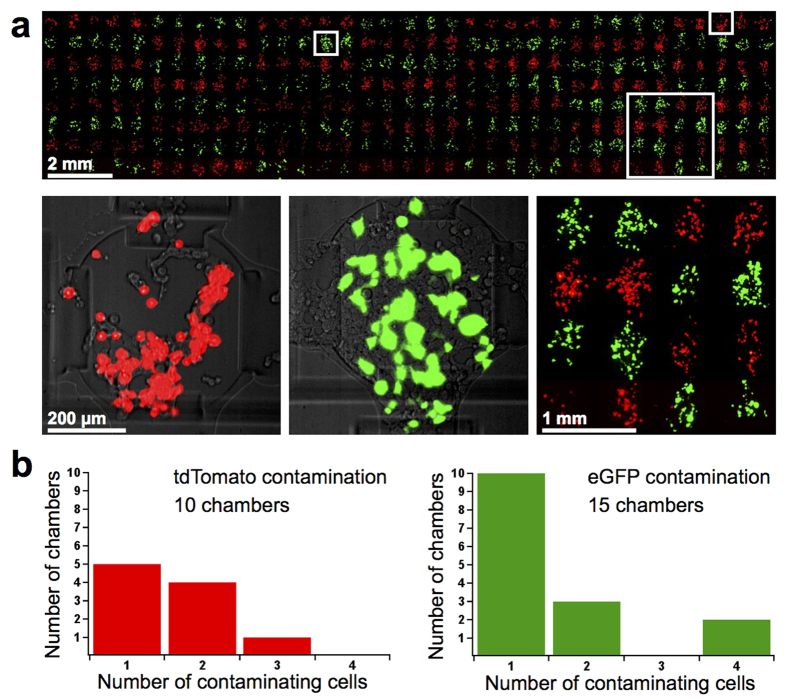
Figure 5. Transfection on the high-throughput chip.
(a) Fluorescence micrograph of the entire transfected 280-chamber chip (upper) and close-up (lower right). Close-up composite fluorescence images indicate tdTomato and eGFP transfection efficiencies. (b) Histograms showing the extent of contamination on the transfected high-throughput chip. eGFP counts were calculated used intensity-adjusted images.

