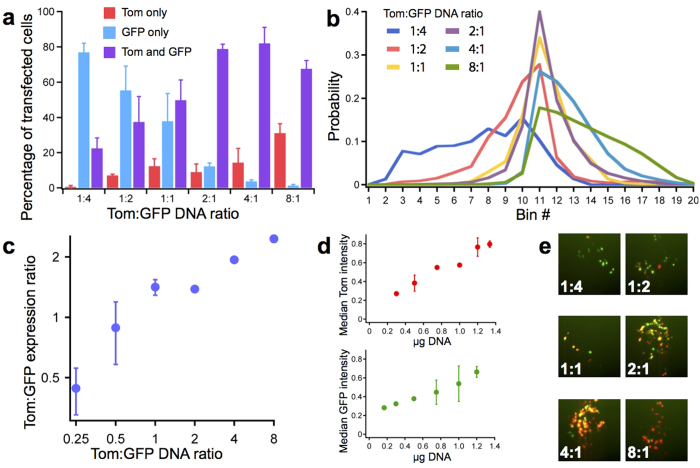
Figure 6. Ratios of protein expression and transfection efficiency during co-transfection on the high-throughput chip.
(a) Transfection efficiencies as a function of the Tom:GFP co-transfection ratio. Each sample represents the average from 10 chambers patterned with a specific Tom:GFP DNA ratio. Error bars show standard deviation. (b) Distribution of Tom:GFP expression ratios. Bin edges span from Tom:GFP expression ratios of 1/6 (left) to 6/1 (right), with increments of 1/0.5 or 0.5/1 (e.g. 1/6, 1/5.5, 1/5 … 5/1, 5.5/1, 6/1). Samples prepared as in (a). (c) Plot indicating the median Tom:GFP expression ratio from each sample shown in (b). Error bars show standard deviation. (d) Protein expression (measured by fluorescence intensity) as a function of the amount of DNA transfected. Samples were prepared as in (a). Error bars show standard deviation. (e) Sample images for each Tom:GFP co-transfection DNA ratio.

