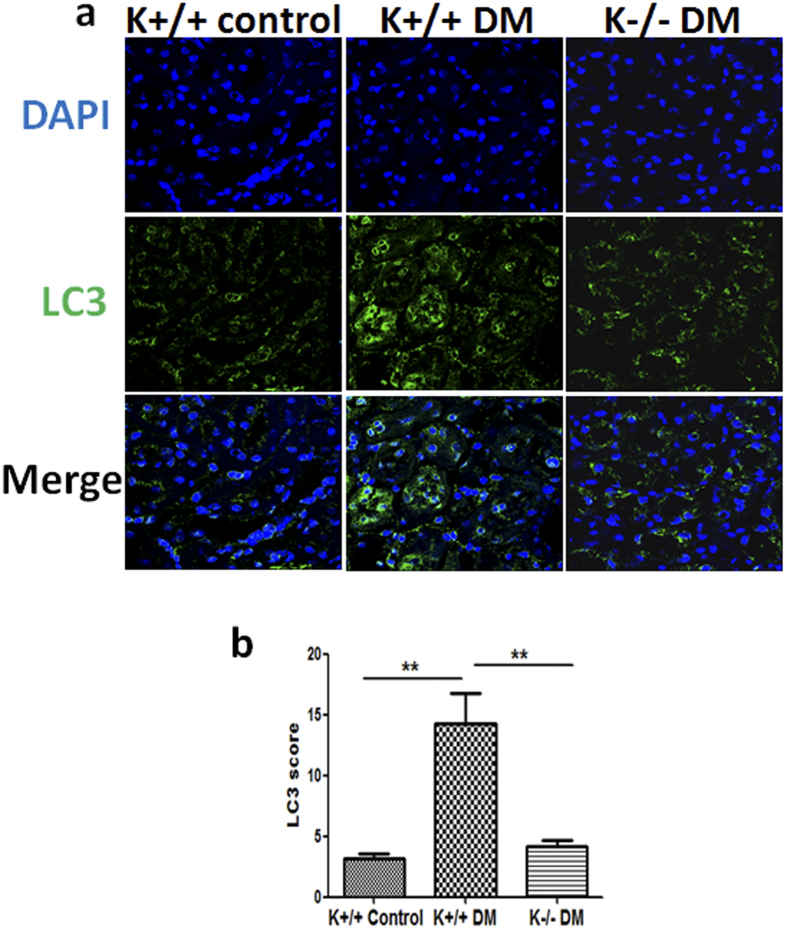
Figure 4. The expression of LC3 in STZ-induced diabetic KCa3.1+/+ and KCa3.1−/−mice.
KCa3.1+/+ and KCa3.1−/− mice were injected with STZ to induce diabetes or citrate buffer alone as non-diabetic controls. After 24 weeks diabetes, kidney tissues were collected for immunostaining. Immunofluorescence staining of LC3 in mice kidney tissues (a). Quantification of LC3 expression in mice kidney tissues (b). Results are presented as mean + SEM. **P < 0.01. N = 8. Original magnification: ×600.

