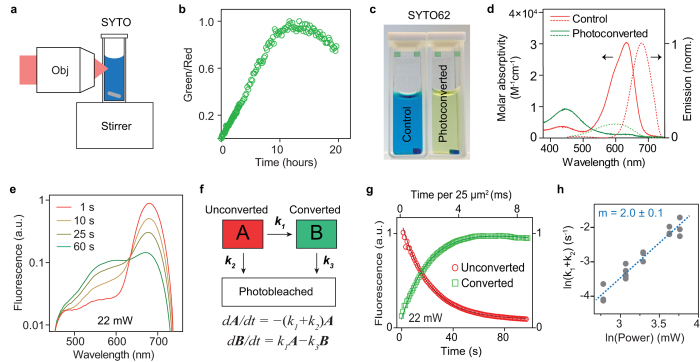
Figure 3. Optical characterization of SYTO62 photoconversion.
(a,b) Photoconversion of a large volume for use for absorption spectroscopy. The sample was photoconverted with 15 hours laser irradiation under stirring. (c) Photographs of a SYTO62 solution-containing sample before and after large-volume photoconversion. (d) Solid line: absorption spectra of the unconverted and converted samples. Dotted line: emission spectra of the unconverted and converted computed using non-negative matrix factorization. (e) Representative spectral kinetics over time during photoconversion. (f) Kinetic model describing photoconversion and photobleaching assuming first-order kinetics, where A and B represent unconverted and converted dye respectively. (g) Representative fitting of the components A and B. (h) Log-log plot of the rate constant vs. excitation power fits to a line with slope of 2.0 ± 0.1.

