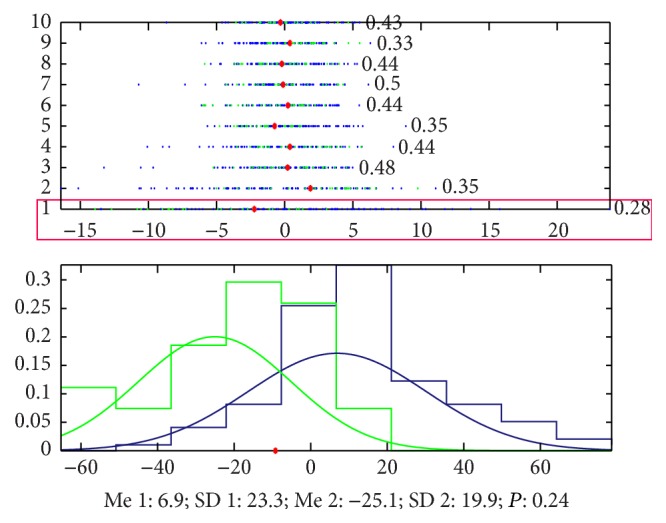
Figure 13.

Classification by PCA. The accuracy that we cannot classify the signals of the 2 groups by the 1st principal component is 0.28, which means that the accuracy to classify this 2 groups is 72%, and the blue points (patients with cirrhosis) mainly appeared in the left side of the red point and the green ones (healthy volunteers) appeared in the right side. And the accuracy by 1st principal component and the 9th principal component is 76%.
