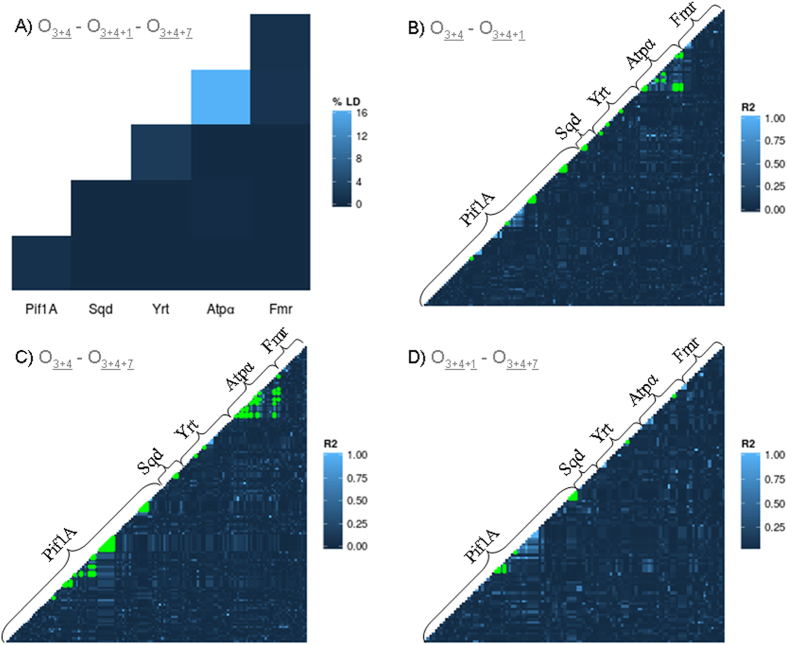
Figure 3.
(A) Percentage of significant LD among O3+4, O3+4+1 and O3+4+7arrangements within and between genes. (B–D) Pairwise LD measured as R2 for O3+4+7–O3+4, O3+4+1–O3+4 and O3+4+1–O3+4+7 comparisons. Green dots correspond to the significant associations after adjusting for multiple comparisons using Benjamini and Hochberg method (1995). Gene order in O3+4 and O3+4+1 is the same (Fig. 1) and has been used for homogeneity in all comparisons.

