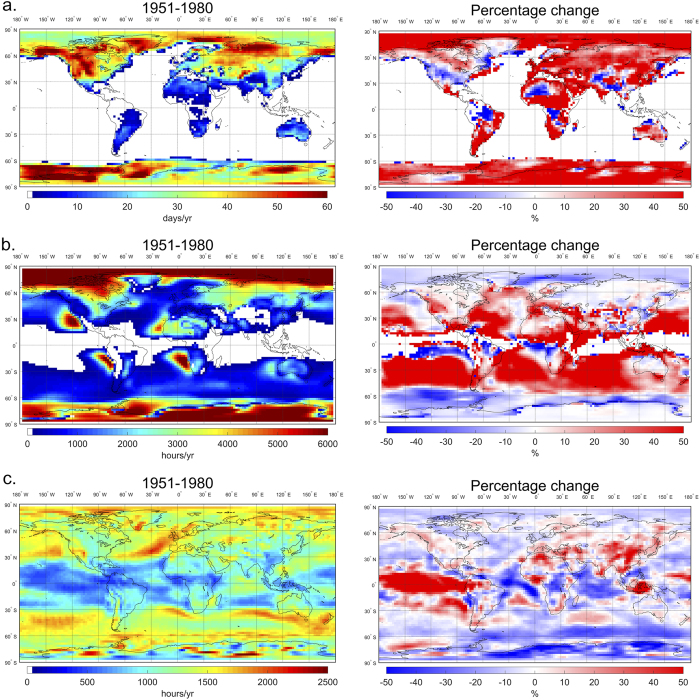
Figure 1. Changes in the frequency of extreme air pollution meteorological events in the past six decades (based on the NCEP reanalysis data): (a) heat waves (days/yr); (b) temperature inversions (hrs/yr); (c) atmospheric stagnation episodes (hrs/yr).
Left: 1951–1980 average; right: percentage change (%) between 1951–1980 and 1981–2010. (Map is generated with coarse coastline built in MATLAB R2014b [URL: http://www.mathworks.com/products/matlab/]).

