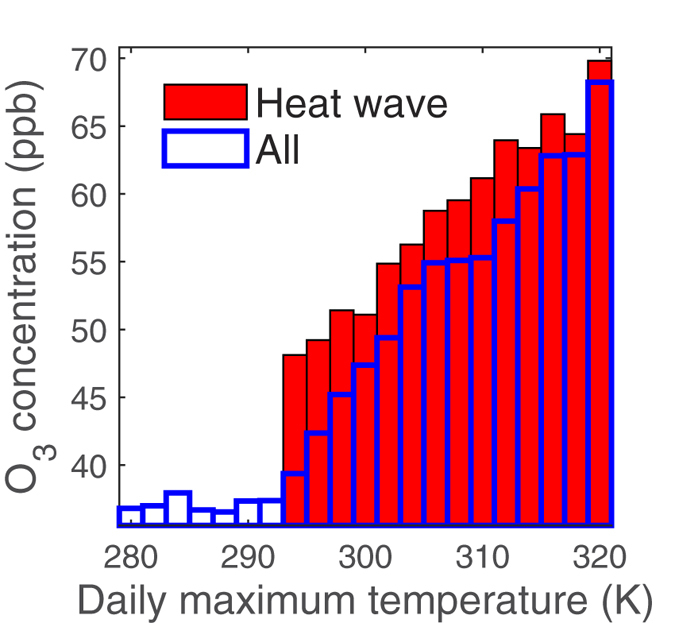
Figure 3. Summer ozone concentrations as a function of daily maximum temperature based on 2001–2010 data in the United States.

Blue curve shows the average ozone concentrations for all the days with temperature falling in specific temperature bins while the red curve only covers days with heat waves.
