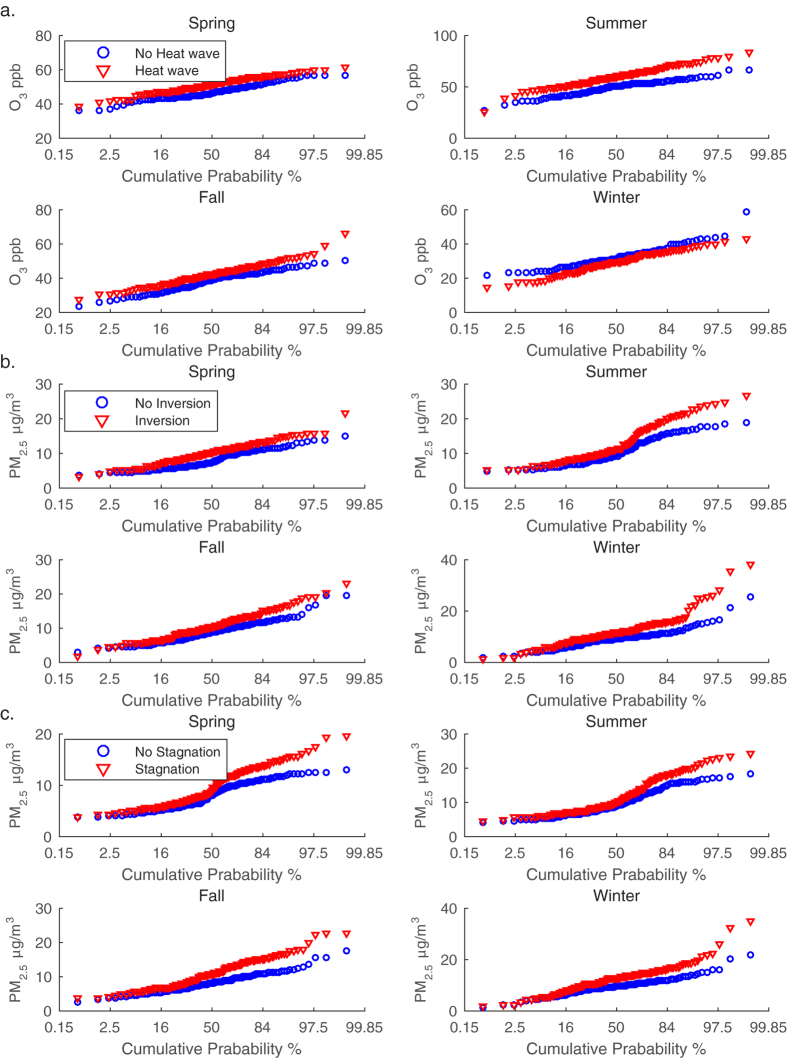
Figure 4. Cumulative probability plots for concentrations of air pollutants.
Red triangle: event group; blue circle: no-event group. (a) ozone mean concentrations of heat wave group and no heat wave group; (b) PM2.5 mean concentrations of temperature inversion group and no temperature inversion group; (c) PM2.5 mean concentrations of atmospheric stagnation group and no atmospheric stagnation group.

