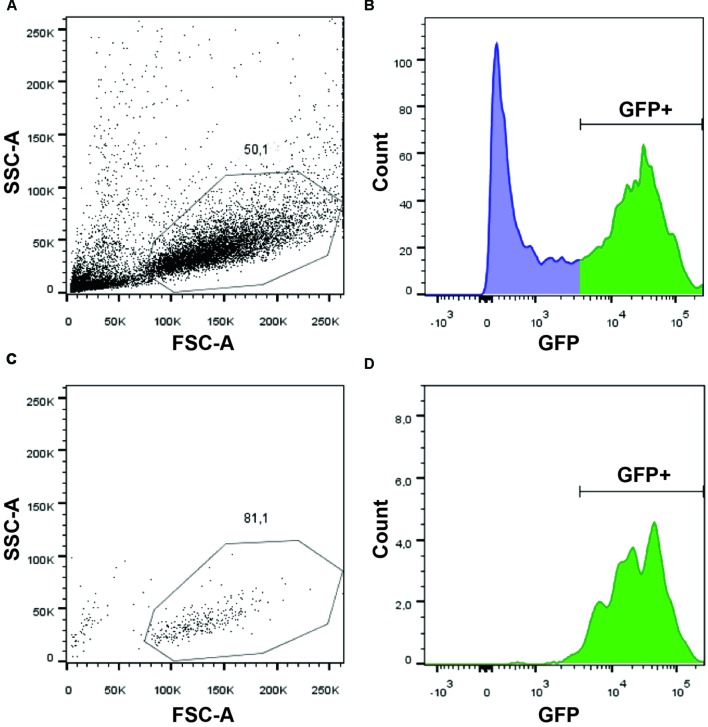
FIGURE 1.
Purification of GFP+ NSCs by FACS. Dissociated cells were analyzed on a BDARIA IIIu FACS and visualized according to their relative size (FCS, Forward Scatter) and granularity (SSC, Side Scatter) before (A) and after (C) cell sorting. About 50% of the events were dissociated cells suitable for sorting. GFP expressing cells were easily identifiable using a 530/30 filter (B). Sorted cells were analyzed post-sorting to confirm the selective and specific sorting of GFP+ cells (D).

