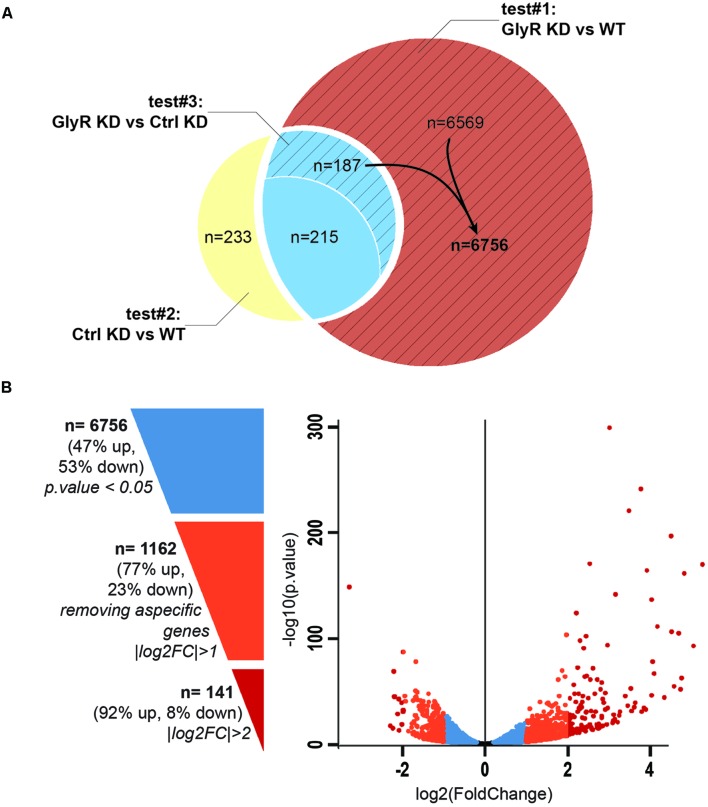
FIGURE 3.
Differential expression analysis. (A) Venn diagram showing the total number of differentially expressed genes in each tests. Test#1 identified a total of 6971 differentially expressed genes (6569 + 187 + 215, p-value < 0.05) by comparing the transcriptome of NSCs from glra4a morpholino-injected (GlyR KD) versus uninjected embryos (WT). Test#2 identified 635 differentially expressed genes between the transcriptome of NSCs from control morpholino-injected (Ctrl KD) versus uninjected (WT) (233 + 215 + 187, p-value < 0.05). 402 genes (215 + 187) were overlapping between tests #1 and #2 (in blue). Test#3 compared the transcriptome of GlyR KD versus Ctrl KD for these 402 genes and identified 187 genes for which the differential expression was significant (p-value < 0.05). These genes were compiled with 6569 genes differentially expressed in GlyR KD (in red) and compose the final list of 6756 specific genes differentially expressed in NSCs upon GlyR KD (stripped red). (B) Volcano plot showing each of the 6756 genes from the final list established above. Blue dots represent the total 6756 specific genes filtered on a p-value < 0.05. Orange dots show the 1162 genes with a |log2FC| > 1 and red dots show the 141 genes with a |log2FC| > 2.

