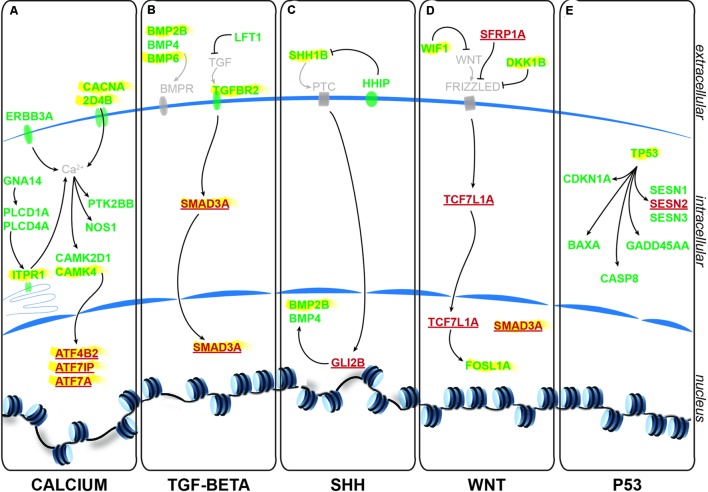
FIGURE 4.
Identified signaling pathways downstream to glycine in NSCs. Representation of the pathways identified and of the key genes involved according to KEGG and IPA. For each signaling pathway (A) calcium, (B) TGF-beta, (C) SHH, (D) WNT, and (E) P53, upregulated genes upon GlyR KD are noted in green and downregulated genes are in red and underlined. Genes highlighted in yellow have been tested by RT-qPCR to confirm RNA-sequencing data (see Figure 5).

