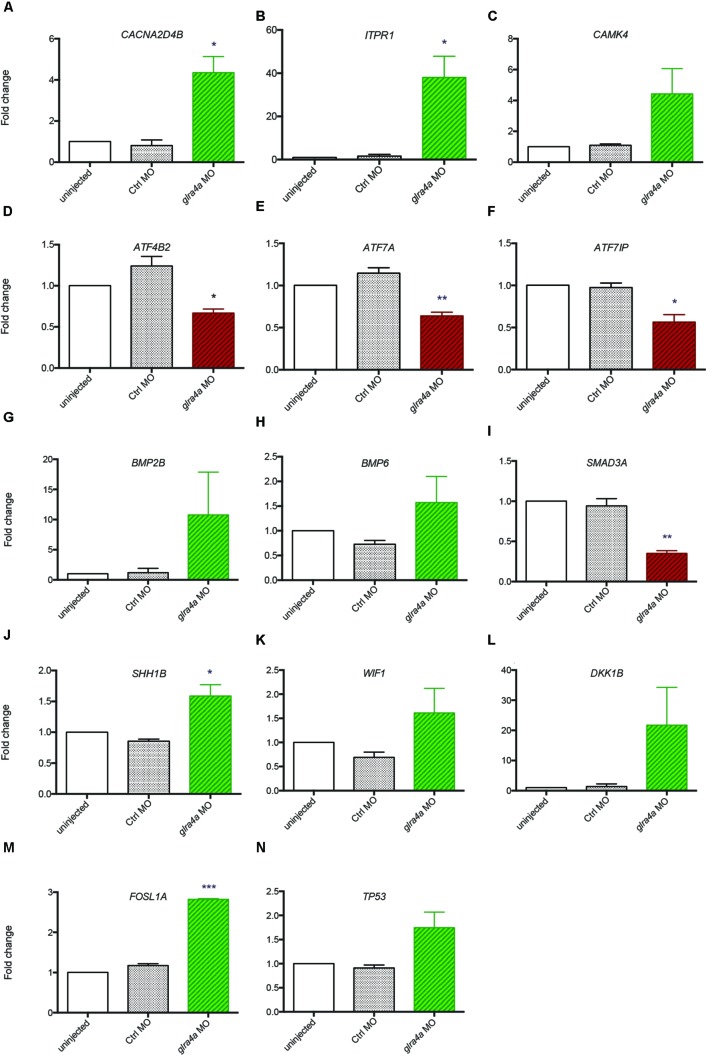
FIGURE 5.
Validation of transcriptomic by RT-qPCR. (A–N) The expression of 14 key genes from each signaling pathway identified were tested by RT-qPCR from independent experiments performed in duplicate: uninjected, Control MO (ctrl MO) and glra4a MO. One-way ANOVA statistical analysis was performed (∗p-value < 0.05, ∗∗p-value < 0.01, ∗∗∗p-value < 0.0001).

