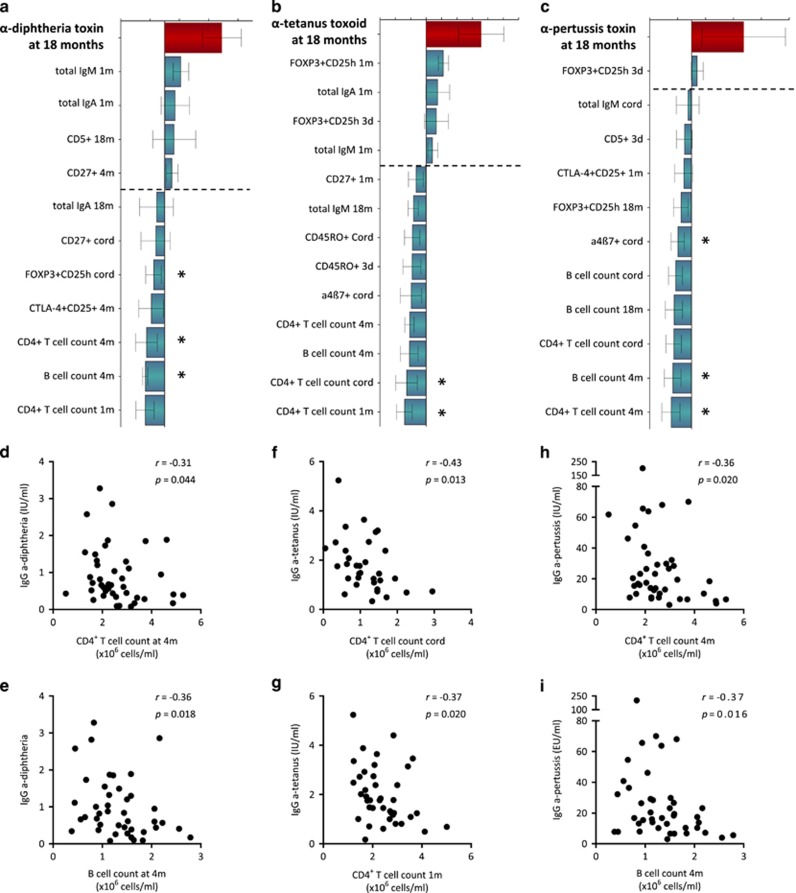
Figure 2.
OPLS-loading column plot displaying the associations between Y, that is, post-vaccination plasma titers of (a) anti-diphtheria toxin antibodies, (b) anti-tetanus toxoid antibody titers and (c) anti-pertussis toxin antibody titers in plasma at 18 months of age. and X variables, that is, T- and B-cell variables over the first 18 months of life that characterize adaptive immune maturation. X variables (that is, immune parameters) with bars projected in the same direction as the Y variable (that is, the respective anti-DTP antibody titers) are positively associated, whereas parameters in the opposite direction are inversely related to the Y variable. The larger the bar and smaller the error bar, the stronger and more certain is the contribution to the model. VIP values are used to discriminate between important and unimportant predictors for the overall model. The OPLS-loading column plots are based on X variables with VIP values⩾1.25(a); 1.20 (b); 1.15 (c). The quality of the OPLS analyses was based on the parameters R2, that is, how well the variation of the variables is explained by the model, and Q2, that is, how well a variable can be predicted by the model. R2Y=0.25 (a); 0.30 (b); 0.29 (c). Q2=0.13 (a); 0.19 (b); 0.10 (c). Statistical significant correlations (Spearman's rank correlation test) between Y and X variables are indicated by asterisks in the respective OPLS analyses. A P-value⩽0.05 was regarded as being statistically significant (*P⩽0.05). (d–i) Representative univariate correlation plots from each OPLS analysis are shown below the respective loadings column plot.

